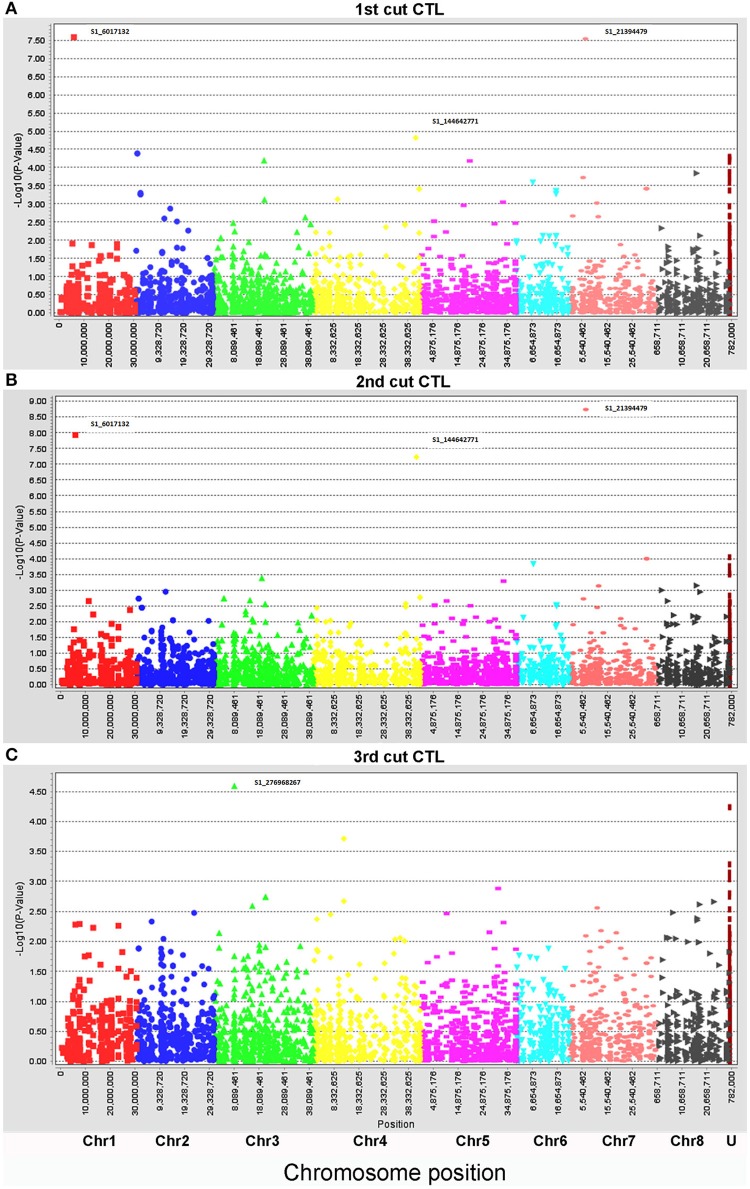
Figure 2.
Manhattan plots of marker-trait association of biomass of alfalfa under well-watered control (CTL) in the field trial. Three harvesting data sets were used for linkage disequilibrium analyses: (A), 1st harvest, (B), 2nd harvest, and (C), 3rd harvest. The physical positions of markers were mapped on 8 chromosomes (Chr1 to 8) and unknown positions (U) (X axes) based on the alignment of sequence tags to the reference genome (Mt 4.0 v1). The marker significances are presented as negative log p-values (Y axes). Significant markers at the top of each plot were indicated by marker names.

