Figure 3.
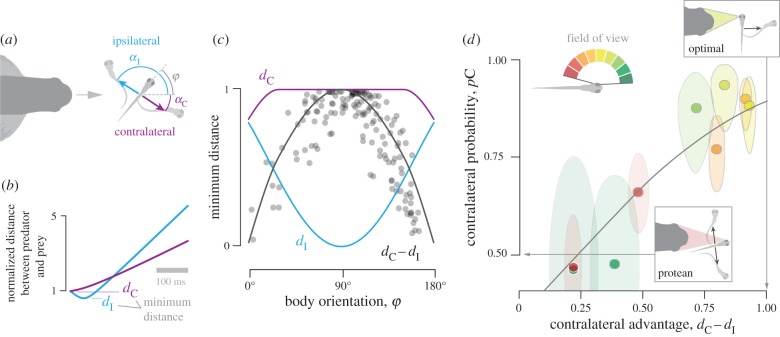
The strategic implications of escape heading. (a) We modelled the escape response as occurring at a right angle from the initial orientation of the body (ϕ) for contralateral (purple) and ipsilateral (blue) escape responses. (b) For each response, the minimum distance between predator and prey were predicted for contralateral (dC) and ipsilateral (dI) escapes, and (c) this was determined for all body orientations. The difference in minimum distance between ipsilateral and contralateral responses (black curve, dC − dI) represents the contralateral advantage. We calculated the contralateral advantage (grey circles) for all positions and orientations recorded in our experiments (figure 1c). (d) The contralateral probability (values from figure 2c) was correlated with the contralateral advantage (logistic regression, p ≪ 0.001, n = 9), when binned with respect to the visual field. These regions of the visual field are colour-coded, as shown in the legend.

