
Figure 1.
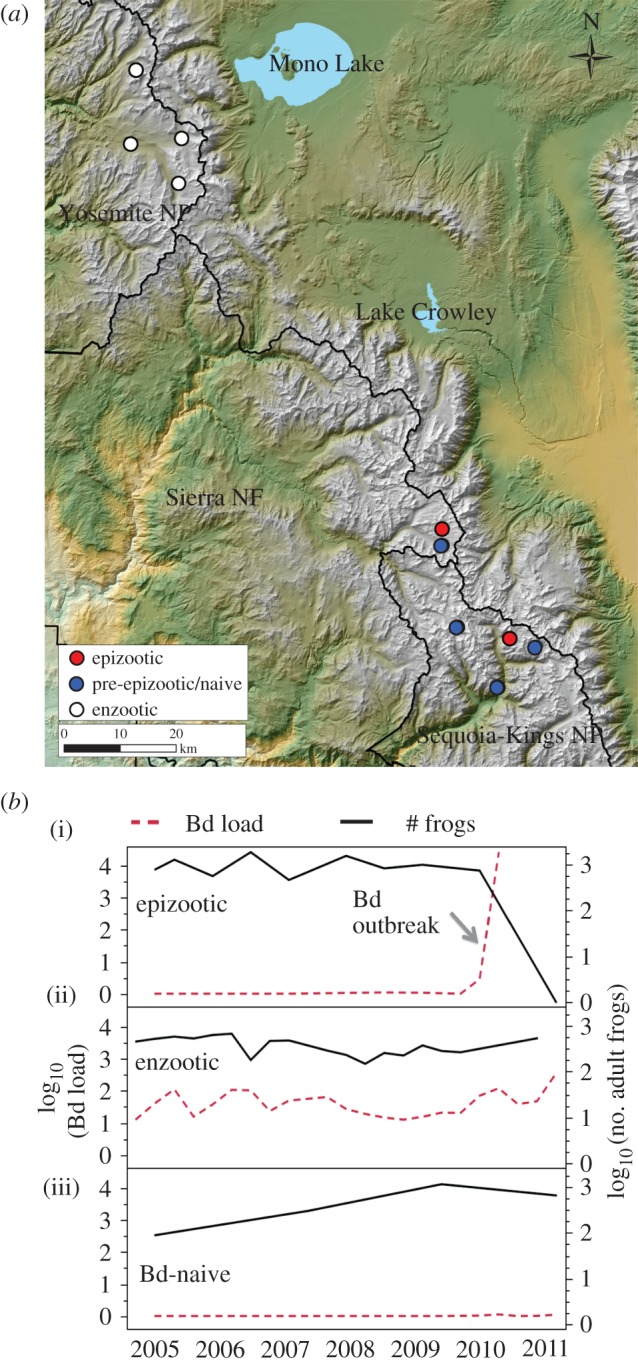
(a) Map showing division between ‘northern’ (Yosemite) and ‘southern’ (Kings Canyon National Park and Sierra National Forest) R. sierrae populations in this study. Northern populations exhibit enzootic dynamics (white markers). Southern locations include populations that were epizootic (red markers) as well as populations that were Bd-naive (pre-epizootic; blue markers). (b) Examples of long-term mean Bd load and population dynamics in three populations. (i) An uninfected population showing stable population numbers until invasion by Bd that resulted in epizootic dynamics and population decline. (ii) An enzootic population exhibiting stable Bd loads and population numbers through time. (iii) A Bd-naive population maintained stable population numbers through time.