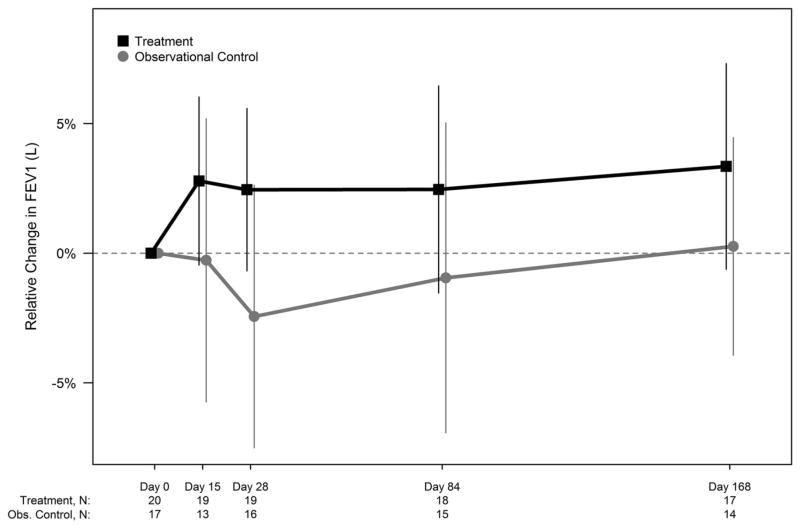
Figure 3. Relative change from screening in FEV1 (Liters) over time by study arm (ITT Population).
Relative change in FEV1 (Liters) from baseline to each post-baseline visit for both study arms in ITT population is shown. 95% confidence intervals (using t-distribution approximation) are included at each time point. The number of participants at each time point is included in a legend below the figure. Per protocol, participants younger than 6 years of age from both the treatment arm (n=3) and observational control arm (n=4) were not assessed for pulmonary function.

