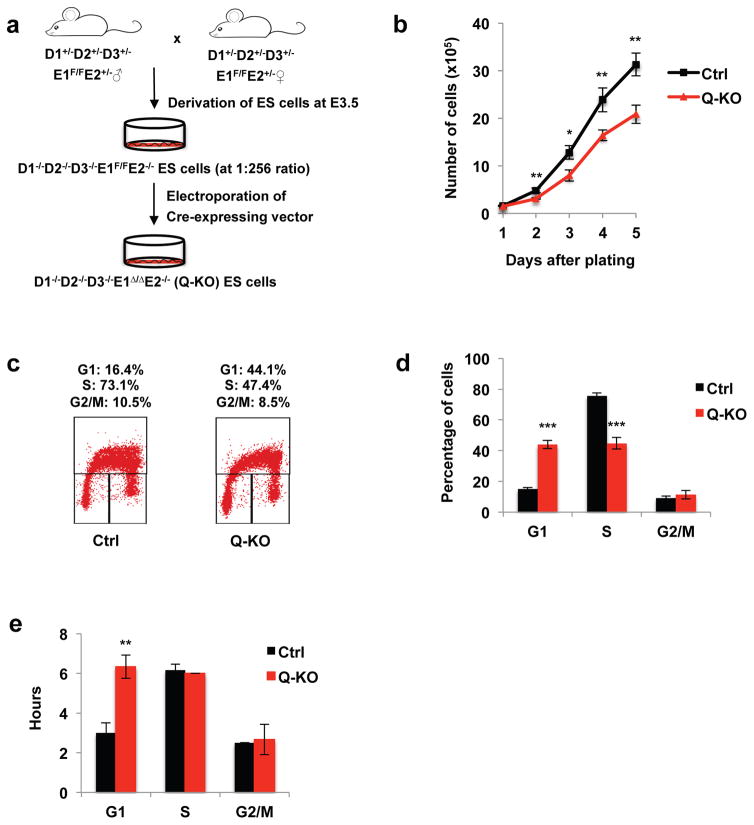
Figure 1. Generation and cell cycle analyses of ES cells lacking all G1 cyclins.
a, A strategy to generate cyclin D1−/−D2−/−D3−/−E1Δ/Δ E2−/− (Q-KO) ES cells. b, Growth curves of control (Ctrl) and Q-KO ES cells during in vitro culture, mean ± standard deviation (s.d.) of n=3 independent experiments. P=0.274, 0.004, 0.01, 0.009, 0.004. c, Cell cycle distribution of control (Ctrl) and Q-KO ES cells. Cells were pulsed with BrdU, stained with an anti-BrdU antibody and propidium iodide and analyzed by flow cytometry. The percentages of cells in the indicated cell cycle phases are shown, representative of n=4 independent experiments. d, Quantification of flow cytometric analyses performed as in c, mean ± s.d. of n=4 independent experiments. P<0.001, <0.001, =0.265. e, The mean length of G1, S and G2/M phases of the cell cycle in Ctrl and Q-KO ES cells. Cells were pulsed with BrdU, and progression of BrdU+ cells through the cell cycle was monitored over time by propidium iodide staining of BrdU+ cells at different time-points. Shown are mean ± s.d. of n=3 independent experiments. P=0.002, 0.374, 0.725. Two-tailed t-tests were used (*, p < 0.05; **, p < 0.01; ***, p < 0.001). Source data for b, d and e can be found in Supplementary Table 5.

