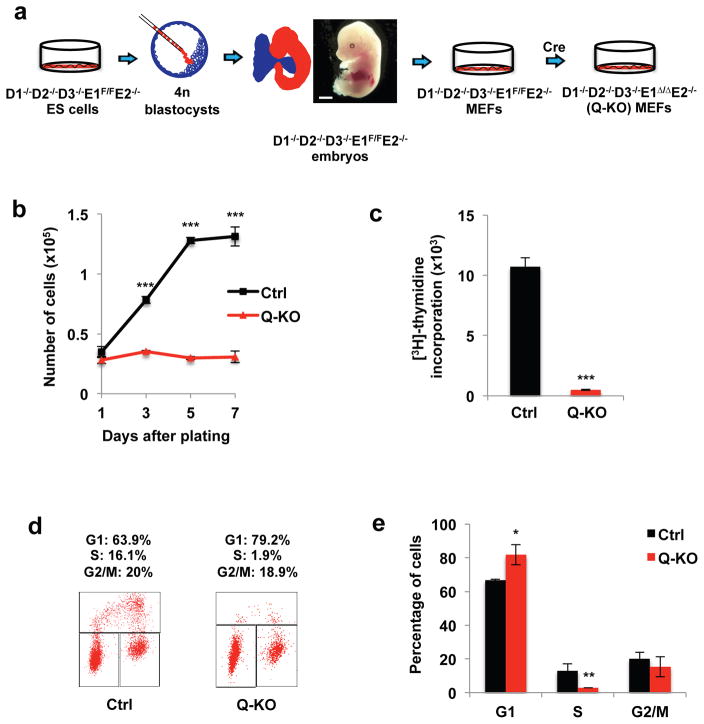
Figure 2. Generation and analyses of Q-KO MEFs.
a, Strategy to obtain Q-KO mouse embryonic fibroblasts (MEFs). Note normal appearance of a cyclin D1−/−D2−/−D3−/−E1F/FE2−/− embryo (representative of n=15 embryos), harvested at day 13.5 of gestation. Scale bar, 500 μm. b, Growth curves of Ctrl and Q-KO MEFs during in vitro culture, mean ± s.d. of n=3 independent experiments. P=0.093, <0.001, <0.001, <0.001. c, Ctrl and Q-KO MEFs were cultured in the presence of [3H]-thymidine, and incorporation into cells was determined by scintillation counting, mean ± s.d. of n=3 independent experiments. P<0.001. d, Cell cycle distribution of control (Ctrl) and Q-KO MEFs. Cells were pulsed with BrdU, stained with an anti-BrdU antibody and propidium iodide and analyzed by flow cytometry. The percentages of cells in the indicated cell cycle phases are shown representative of 3 independent experiments. e, Quantification of flow cytometric analyses performed as in d, mean ± s.d. of n=3 independent experiments. P=0.027, 0.016, 0.614. Two-tailed t-tests were used (*, p < 0.05; **, p < 0.01; ***, p < 0.001). Source data for b, c and e can be found in Supplementary Table 5.

