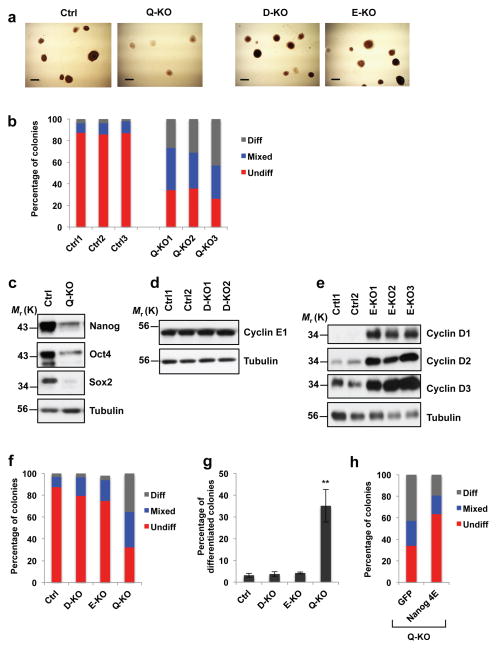
Figure 3. Attenuation of ES cell pluripotency upon ablation of G1 cyclins.
a, Alkaline phosphatase (AP) staining of Ctrl, D1−/−D2−/−D3−/−E1Δ/Δ E2−/− (Q-KO), D1−/−D2−/−D3−/− (D-KO) and E1Δ/Δ E2−/− (E-KO) ES cell colonies. Cells were analyzed 5 days after plating, representative of 5 independent experiments Scale bar, 250 μm. b, Bars show mean percentages of differentiated (Diff) AP-negative, mixed (some cells AP-positive, some -negative) and undifferentiated (Undiff) uniformly AP-positive ES cell colonies, 3 independent lines. c, Immunoblot analysis of Nanog, Oct4 and Sox2 protein levels in Ctrl and Q-KO ES cells, representative of 4 independent experiments. d, Immunoblot analysis of cyclin E1 protein levels in two independent lines of control (Ctrl1 and Ctrl2) and cyclin D-KO (D-KO1 and D-KO2) ES cells, representative of 3 independent experiments. e, Immunoblot analysis of the levels of D-type cyclins in independent lines of control (Ctrl1 and Ctrl2) and cyclin E-KO ES cells (E-KO1, E-KO2, and E-KO3), representative of 3 independent experiments. In c–e tubulin served as a loading control. f, Same analysis as in b, showing mean percentages of differentiated, mixed and undifferentiated colonies, 3 independent lines. g, Mean percentages of differentiated (AP-negative) colonies in ES cells of the indicated genotypes, mean ± s.d. of n=3 independent experiments. P=0.388, 0.056, 0.002. Two-tailed t-tests were used (**, p < 0.01). h, Q-KO ES cells were transduced with lentiviruses encoding GFP, or encoding a Nanog mutant containing phospho-mimicking glutamic acid substitutions in all four cyclin E-CDK2-dependent phosphoresidues (Nanog 4E), and colonies were stained with alkaline phosphatase. Bars show mean percentages of differentiated (Diff), mixed, and undifferentiated (Undiff) colonies (as in b), 3 independent lines. Source data for b, f, g and h can be found in Supplementary Table 5. Unprocessed original scans of blots are shown in Supplementary Fig. 9.

