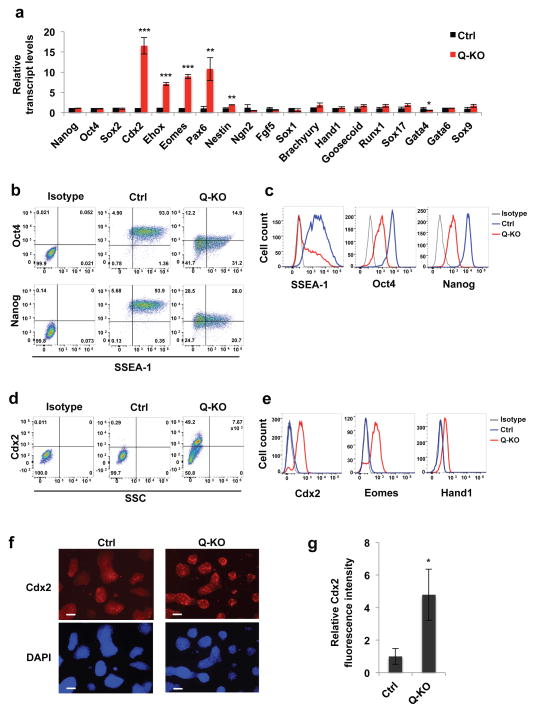
Figure 4. Analyses of differentiation markers in Q-KO ES cells.
a, Relative expression levels of the indicated transcripts in Ctrl and Q-KO ES cells, determined by reverse-transcription quantitative PCR. Shown are mean values ± s.d. of n=3 independent experiments. P=0.485, 0.612, 0.56, <0.001, <0.001, <0.001, =0.004, 0.001, 0.22, 0.091, 0.113, 0.06, 0.138, 0.061, 0.058, 0.145, 0.013, 0.142, 0.057. Mean expression levels observed in Ctrl ES cells were set as 1. b, c, Ctrl and Q-KO ES cells were permeabilized, stained with antibodies against SSEA-1, Oct4 or Nanog, and analyzed by flow cytometry. Panel c shows distribution of staining intensities. Isotype, isotype-specific IgG control. The mean percentages of SSEA-1+ cells for Ctrl and Q-KO cells were 95.4 ± 2.7 and 49.4 ± 6.5 (± s.d.), respectively, p < 0.001; for Oct4+ cells 94.7 ± 1.2 and 35.7 ± 9.7, respectively, p = 0.0025; and for Nanog+ cells 96.1 ± 2.8 and 44.3 ± 11.0, respectively, p < 0.001 (two-tailed t-test). d, e, Cells were permeabilized, stained with antibodies against Cdx2, Eomes or Hand1, and analyzed by flow cytometry. SSC, side scatter. Isotype, isotype-specific IgG control. Panel e shows distribution of staining intensities. The mean percentages of Cdx2+ cells were 1.3 ± 1.0 for control cells and 47.2 ± 14.1 for Q-KO cells (± s.d.), p < 0.0016 (two-tailed t-test). f, Immunostaining of Ctrl and Q-KO ES cell colonies for Cdx2 protein. Lower panels represent DAPI staining (to visualize cells). Scale bar, 100 μm. g, Quantification of immunofluorescence staining of Ctrl and Q-KO ES cell colonies for Cdx2, mean ± s.d. of n=3 independent experiments. P=0.016. Two-tailed t-tests were used (*, p < 0.05; **, p < 0.01; ***, p < 0.001). Shown in b–f are representatives of n=3 independent experiments Source data for a and g can be found in Supplementary Table 5.

