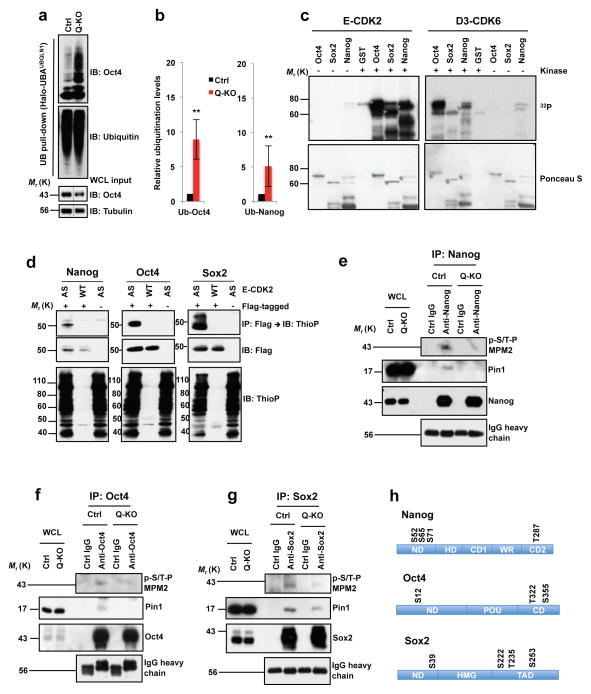
Figure 7. Regulation of Nanog, Oct4 and Sox2 levels by G1 cyclins.
a, Polyubiquitin affinity purification (UB pull-down), immunoblotted with Oct4 and ubiquitin antibodies. WCL input: Oct4 levels in whole cell lysates (WCL), prior to purification (same as lanes 2, 4 in Supplementary Fig. 4e; middle portion spliced out (dashed lines). b, Left panel: quantification of a, mean ± s.d. of n=4 independent experiments. P=0.001. Band intensities corresponding to polyubiquitinated Oct4 were normalized against Oct4 total levels in Ctrl or Q-KO lysates prior to purification. Ctrl ES cells value is set at 1. Right panel: similar analysis of Nanog polyubiquitination, mean ± s.d. of n=4 independent experiments. P=0.001. Two-tailed t-tests (**, p < 0.01). c, In vitro kinase reactions. Recombinant GST-Nanog, GST-Oct4, GST-Sox2, or GST incubated in presence (+) or absence (−) of E1-CDK2 or D3-CDK6 with 32PγATP. Lower panel: Ponceau S staining of membranes. Green stars mark full-length GST-Nanog, -Oct4 and -Sox2. d, In-cell kinase reactions. 293T cells transfected with cyclin E1 and analog-sensitive CDK2 (AS), or wild-type CDK2 (WT), and Flag-tagged Nanog, Oct4 or Sox2 (+Flag-tagged) or empty vectors (−), and incubated with N6-PhEt-ATPγS. Upper panels: Flag-tagged Nanog, Oct4 or Sox2 proteins were immunoprecipitated (IP) with anti-Flag, immunoblots probed (IB) with anti-thiophosphate ester (ThioP). Middle panels: anti-Flag. Lower panels: lysates immunoblotted with anti-ThioP. Control lanes 3 and 6 are the same. e–g, ES cells were treated with MG132 to equalize Nanog, Oct4 and Sox2 levels in Ctrl and Q-KO cells. Endogenous Nanog, Oct4 or Sox2 proteins were immunoprecipitated (control: lysates treated with IgG), and immunoblotted with antibody against phosphorylated Ser/Thr-Pro (p-S/T-P MPM2, upper panel). Middle and third panels: anti-Pin1 and anti-Nanog/Oct4/Sox2. Bottom panel: IgG heavy chain control. Proteins levels in WCLs were analyzed. h, Cyclin E-CDK2-dependent phosphoresidues, mass spectrometric analysis. ND, N-terminal domain; HD, homeodomain; CD1, C-terminal domain 1; WR, tryptophan repeat; CD2, C-terminal domain 2; POU, POU-specific DNA-binding domain; CD, C-terminal domain; HMG, High mobility group DNA-binding domain; TAD, transactivation domain. Results representative of 3 (c–g) or 4 (a) independent experiments. Source data for c–e in Supplementary Table 5. Unprocessed blots in Supplementary Fig. 9.

