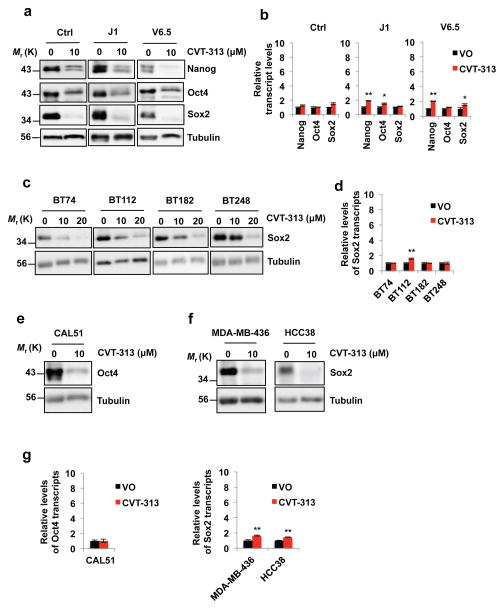
Figure 8. Decreased levels of Nanog, Oct4 and Sox2 proteins upon treatment of ES cells and human cancer cells with a CDK Inhibitor CVT-313.
a, In vitro cultured control ES cells derived from a mouse blastocyst of the mixed genetic background C57BL/6 × 129Sv (Ctrl), or wild-type J1 ES cells (from 129S4/SvJae strain), or wild-type V6.5 ES cells (from C57BL/6 × 129/Sv cross) were treated with vehicle only - DMSO (0) or with 10 μM CVT-313. The levels of Nanog, Oct4 and Sox2 proteins were assessed by immunoblotting. b, Reverse transcription-quantitative PCR (RT-qPCR) analysis of Nanog, Oct4 and Sox2 transcript levels, from ES cells treated with vehicle only (VO) or CVT-313, as in a, mean ± s.d. of n=3 independent experiments. P=0.053, 0.565, 0.550, 0.001, 0.020, 0.064, 0.002, 0.053, 0.016. c, Patient-derived glioblastoma cell lines were cultured as tumor-initiating cells in serum-free neural stem cell medium in the form of neurospheres. Cells were treated with the indicated concentrations of CVT-313 or vehicle only (0), and the levels of Sox2 protein were determined by immunoblotting. d, RT-qPCR analysis of Sox2 transcript levels, from glioblastoma cells treated with vehicle only (VO) or CVT-313, as in c, mean ± s.d. of n=3 independent experiments. P=0.627, 0.001, 0.962, 0.98. e and f, In vitro cultured human triple-negative breast cancer cell lines CAL51, MDA-MB-436 and HCC38 were treated with 10 μM CVT-313 or with vehicle only (0), and the levels of Oct4 (e), or Sox2 proteins (f) were determined by immunoblotting. g, RT-qPCR analysis of Oct4 or Sox2 transcript levels, from breast cancer cell lines treated with vehicle only (VO) or CVT-313, as in e and f, mean ± s.d. of n=3 independent experiments. P=0.928, 0.002, 0.001. In a, c, e, f, tubulin served as a loading control. Results are representative of n=3 independent experiments. Two-tailed t-tests were used (*, p < 0.05; **, p < 0.01). Source data for b, d and g can be found in Supplementary Table 5. Unprocessed original scans of blots are shown in Supplementary Fig. 9.

