Fig. 5.
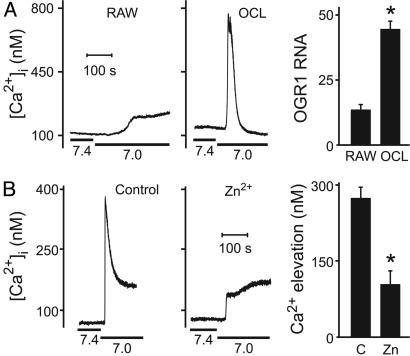
Expression and function of OGR1 in osteoclast-like cells and osteoclasts. (A) RAW 264.7 cells were grown for 5 or 6 days without (RAW) or with RANKL to induce differentiation of osteoclast-like cells (OCL). (Left and Center) Acidification from 7.4 to 7.0 was induced where indicated by bar below the Ca2+ traces. (Left) Response is representative of nine of nine samples of tested undifferentiated RAW 264.7 cells. (Center) Response is representative of seven of eight tested single osteoclast-like cells. (Right) Quantitative real-time RT-PCR was performed by using a primer/TaqMan probe set specific for OGR1 on RNA isolated from undifferentiated RAW 264.7 cells and differentiated osteoclast-like cells. OGR1 mRNA levels were normalized to endogenous ribosomal RNA and expressed relative to levels in liver. Data are means ± SEM, and difference was assessed by using Student's t test. *, P < 0.005, from three independent experiments. (B) OGR1 antagonist Zn2+ inhibits acid-induced elevation of [Ca2+]i in authentic rat osteoclasts. (Left) Representative response in control rat osteoclast. (Center) Response is diminished after treatment with Zn2+ (100 μM, 10 min in the bath). (Right) After treatment with Zn2+, amplitudes of acid-induced Ca2+ transients are significantly decreased. *, P < 0.001. Data are means ± SEM. Difference was assessed by using Student's t test; n = 16 for control (C) and n = 9 for Zn2+-treated (Zn) osteoclasts.

