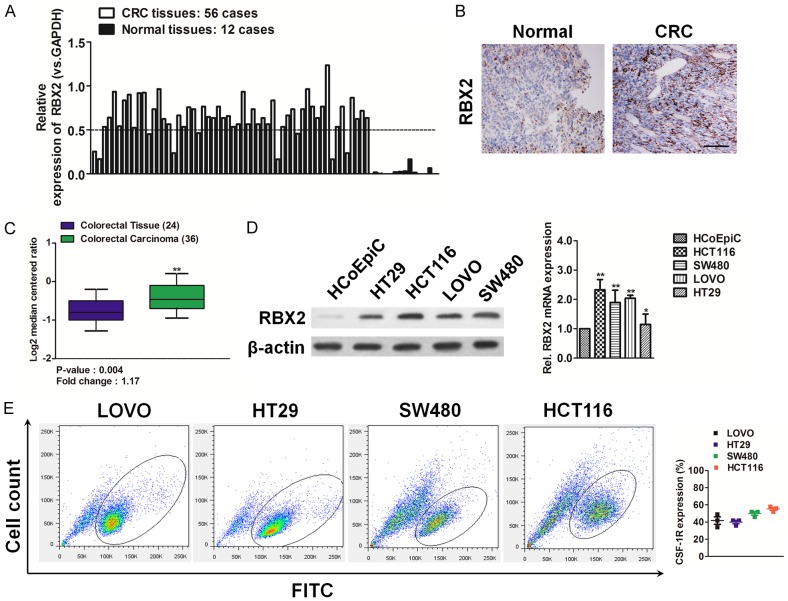
Figure 1.
Overexpression of RBX2 in colorectal carcinoma tissues and cell lines. A. Relative expression of RBX2 mRNA in 56 CRC cancer and paired adjacent normal tissues as determined by qPCR. Increased expression of RBX2 mRNA as compared with normal tissue was observed. B. Expression of RBX2 protein was determined by IHC analysis. Representative images of IHC staining of RBX2 in CRC cancer tissues and adjacent normal tissues. Scale bar represents 100 μm. C. Box plots show increased levels of RBX2 in CRC (right) compared with normal tissues in Skrzypczak colorectal microarray data set. **P < 0.01, compared with normal colon tissues was determined by the Student’s t test. D. Western blotting analysis (left panel) of the level of RBX2 in various CRC cell lines. β-actin was used as loading controls. qPCR analysis (right panel) of RBX2 mRNA level in CRC cells. PCR values were normalized to the levels of β-actin. Data were presented as the mean ± SD from three independent measurements. E. Representative fluorescence activated cell sorter (FACS) dot plots of HCT116, SW480, LOVO, and HT29 cells stained with the anti-RBX2 antibody. Histograms reported the percentage of RBX2 positive cells as assessed by FACS. Mean ± SD of three independent experiments. Quantitative analysis demonstrates expression of RBX2 positive CRC cells range from 40%-60%.

