
Figure 2.
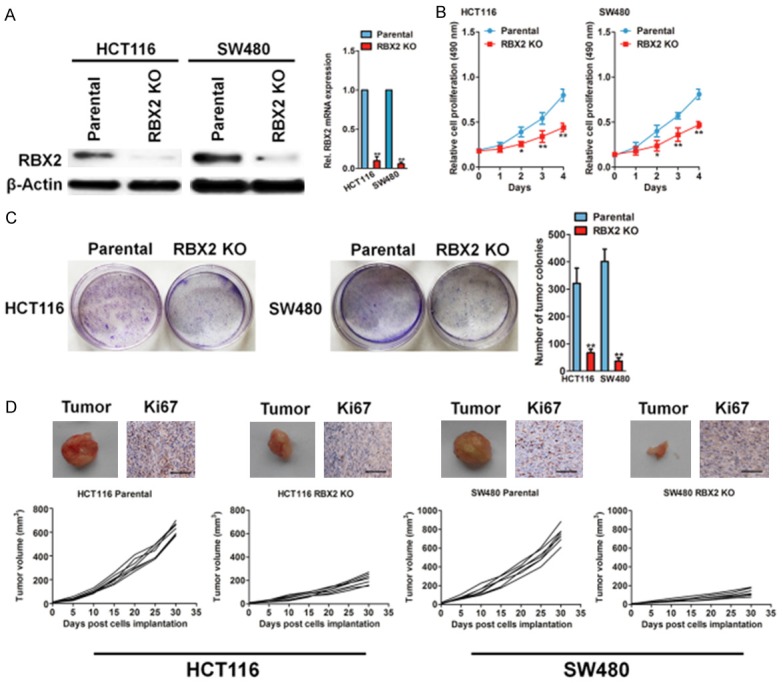
RBX2 depletion inhibits growth in colorectal cancer cells. A. Western blot to test the efficiency and specificity of RBX2 knockout plasmid transfection was shown completely loss of RBX2 relative to parental HCT116 and SW480 cells (left panel). qPCR analysis of RBX2 mRNA levels in both CRC cell lines. PCR values were normalized to the levels of β-actin. Data are presented as the mean ± SD from three independent measurements. B. Cell growth rate from parental and RBX2 knockout HCT116 cells (left) and SW480 cells (right) at indicated time point. C. Colony formation assay of parental and RBX2 knockout HCT116 and SW480 cells. 1000 cells were plated in 6-well plate in complete medium and cultured for 14 days and colonies were stained and counted. D. Representative images of xenografts. Tumor growth curve for HCT116 (left panel) and SW480 (right panel) xenogaft tumor models. Immunohistochemistry analysis of RBX2 and Ki67 in xenografts of the indicated groups. Scale bar represents 100 μm.