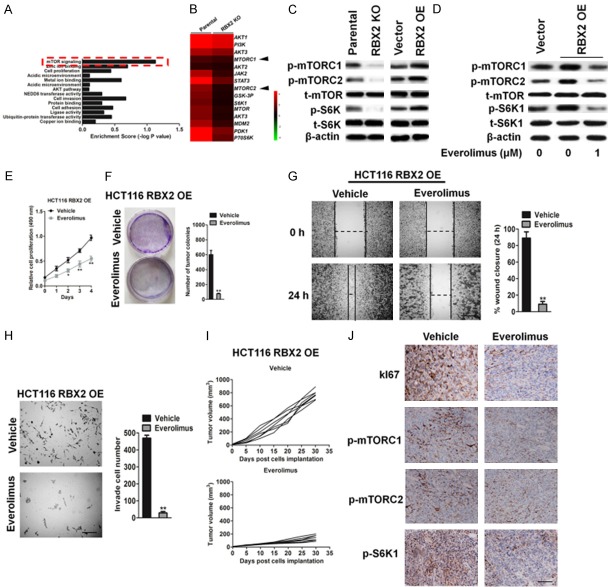
Figure 7.
Inhibition of mTOR significantly suppresses RBX2 over-expression tumor cell growth. A. Enrichment scores of signaling pathways among RBX2 targets. B. Heat-map of genes differentially expressed in parental cells and RBX2 KO HCT116 cells. C. Western blot analysis of the expression of p-mTORC1S2448, p-mTORC2S2481, t-mTOR, p-S6K1T389 and S6K1 in the HCT116 cells in response to RBX2 up-regulation. β-actin was used as loading control. D. Whole cell lysates were prepared from everolimus and vehicle treated HCT116-RBX2 cells and examined for p-mTORC1S2448, p-mTORC2S2481, t-mTOR, p-S6K1T389 and S6K1 by immunoblotting. E. Cell growth rate from everolimus and vehicle treated HCT116-RBX2. F. Representative pictures (left panel) and statistical analysis (right panel) shown colony formation from everolimus and vehicle treated HCT116-RBX2 cells. G. In vitro wound closure of everolimus and vehicle treated HCT116-RBX2 cells from 24 h after scratch assay. Scale bar: 100 μm. H. Transwell invasion assay of everolimus and vehicle treated HCT116-RBX2 cells (left panel). Quantification of invasive cells per field was analyzed (right panel). Scale bar: 100 μm. Data were compared using the two-tailed students t-test, for indicated comparisons, **P < 0.01 compared to the cells treatment with vehicle. I. Mice were injected with HCT116-RBX2 cells and then were treated with everolimus and vehicle (n = 6). Tumor volume was analyzed at indicated time point. J. Histochemistry staining of Ki67, p-mTORC1S2448, p-mTORC2S2481 and p-S6K1T389 shown decreased positive cells from everolimus treated tumors originally from injection of HCT116-RBX2 cells compare to vehicle-treated group. Scale bar: 100 μm.

