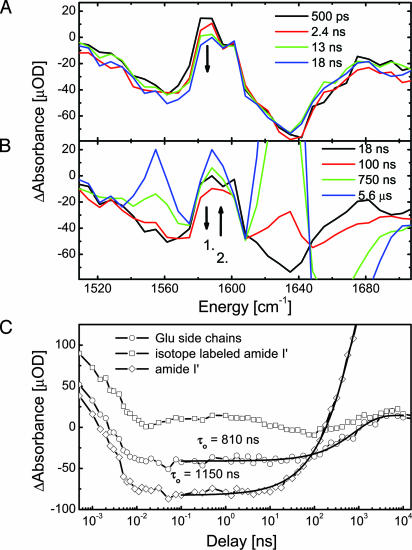
Fig. 4.
Dynamics of selected spectral positions in the early nanosecond range at 20°C. (A) Decreasing absorption at the isotope position. (B) Decrease at the isotope position continues until 100 ns, by which time build up at the amide I′ and Glu position has begun already. Only after 100 ns does the absorption at the isotope position rise. (C) Dynamics at selected spectral positions. The solid lines are fits with stretched exponentials.

