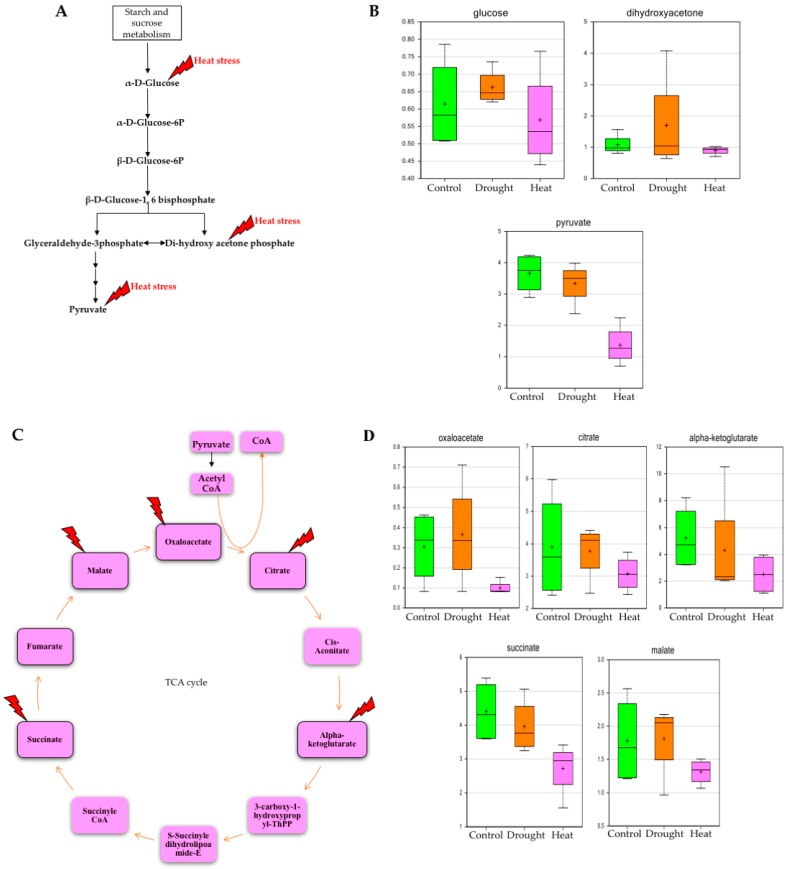
Figure 2.
Effects of drought and heat stresses on the metabolites of glycolysis and the tricarboxylic acid (TCA) cycle. (A) Glycolysis pathway showing the metabolites that had abundances significantly affected by stresses in the study; (B) Box plots showing the relative abundances of glucose, dihydroxyacetone and pyruvate under the control, drought, and heat stress conditions. (C) TCA cycle showing metabolites that were found to have significant effect on their abundance of stress (D) Box plots showing relative abundances of metabolites of TCA cycle under various stressed conditions [the Y axis defines the relative abundances of specific metabolite and X axis defines the treatment group; the red lightning sign in panels (A,C) indicates heat stress; green box plot: control, orange box plot: drought and pink box plot: heat]. Inside the box plots, “+” indicates mean value, and “—“ indicates median value.

