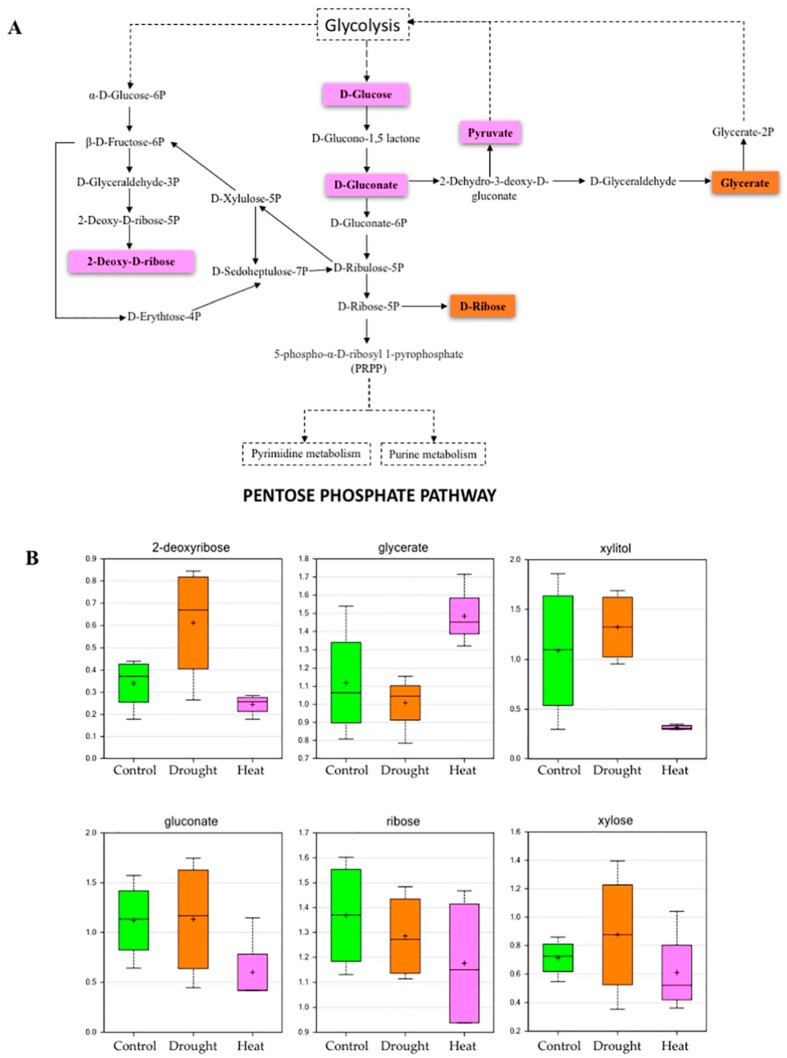
Figure 3.
Effect of drought and heat stresses on metabolites related to the pentose phosphate pathway. (A) The pink colored metabolites indicate downregulation in response to heat stress, orange colored metabolites indicate downregulation in response to drought stress. (B) Box plots showing relative abundances of PPP metabolites and sugar compounds under control, drought, and heat stress conditions (pink highlights indicate heat stress-affected; box plot description is the same as Figure 2).

