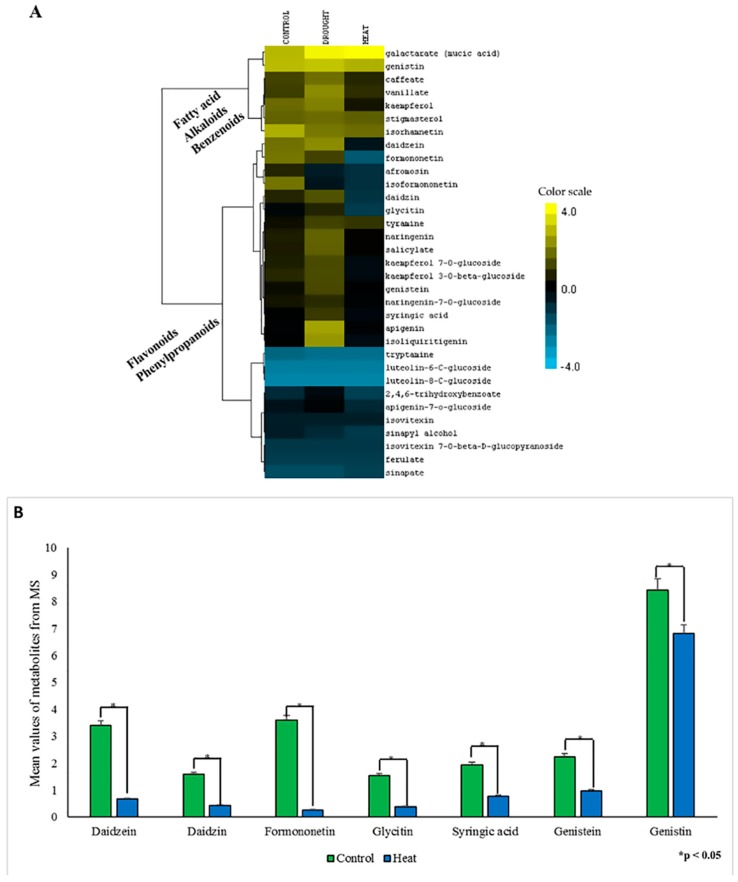
Figure 7.
Effect of drought and heat stress on secondary metabolites. (A) Heat map showing differential expressions of various secondary metabolites during drought and heat stress compared to the control treatment. (B) Bar diagram showing relative expression of various phytochemicals in response to heat stress (blue) compared to the control (green). Various phytochemicals are shown on the X-axis, and the Y-axis has the scaled intensity of the respective phytochemical. Each value represents the mean ± S.E., and the asterisks designate the significance of changes from their corresponding control (p < 0.05).

