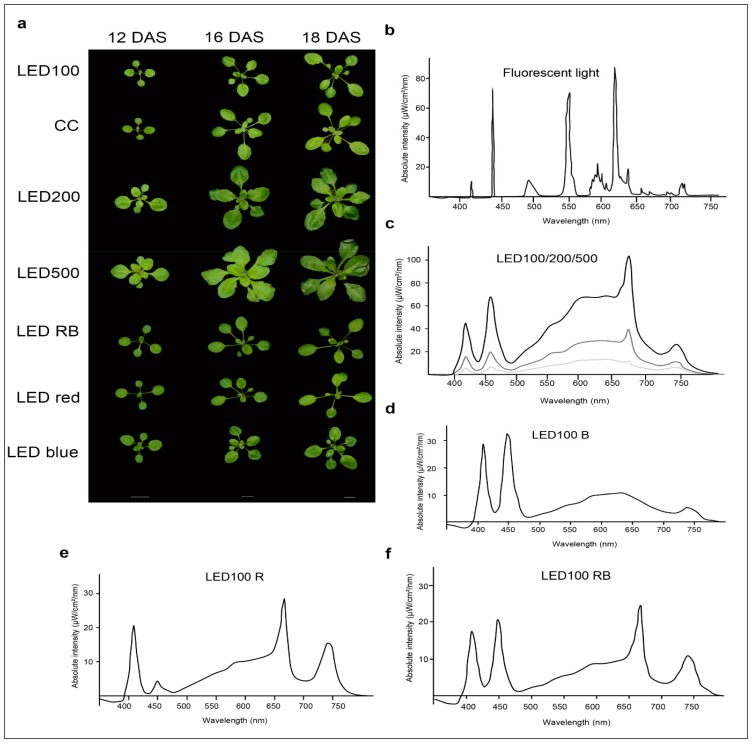
Figure 1.
Arabidopsis thaliana shows distinct growth behaviour under different light and climate regimes. (a) Phenotypes of plants grown at either 100 µmol m−2 s−1 under white light-emitting diode (LED) light (LED100) or fluorescent light in a climatic chamber, or LED light at 200 µmol m−2 s−1 or 500 µmol m−2 s−1 LED red, LED blue or LED red/blue. Plants were grown on soil and photographed at 12, 16, and 18 days after sowing (DAS). The scale bar represents 1 cm; (b–f) Spectra of the different light regimes. Please note that the total light intensity represents the area below the spectral curves. Thus, the peak heights at the different wavelengths do not reach the value of the total output; (b) Spectrum of the fluorescent lamp in the climate chamber; (c) LED spectra at 100 (lower light grey curve), 200 (middle dark grey curve), and 500 µmol m−2 s−1 (upper black curve); (d) LED spectrum for LED100 with a raised portion of blue light (B); (e) LED spectrum for LED100 with a raised portion of red light (A); (f) LED spectrum for LED100 with a raised portion of red/blue light R/B).

