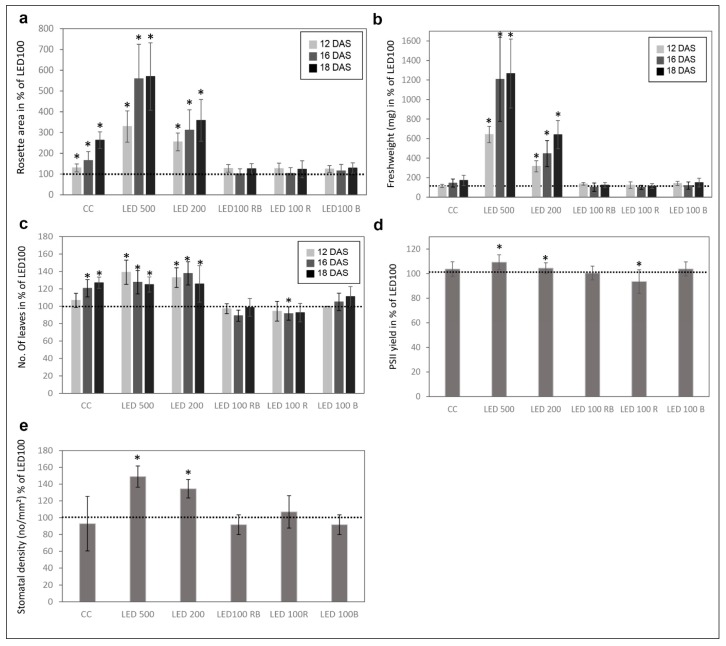
Figure 2.
Physiological parameters of plants grown under different light regimes. (a) Mean rosette area in % compared to LED100 from n = 6 plants measured at 12, 16, and 18 DAS. The dotted line represents the value of plants grown at LED100 in all graphs; (b) Mean fresh weight (mg) from n = 6 plants at 12, 16, and 18 DAS; (c) Number of leaves in % compared to LED100 from n = 6 plants measured at 12, 16, and 18 DAS; (d) PSII yield from plants at 18 DAS in % compared to LED100; (e) Stomatal density given in number/mm2 from plants at 18 DAS. Significant changes compared to LED100 according to the student’s T test are indicated by an asterisk (*).

