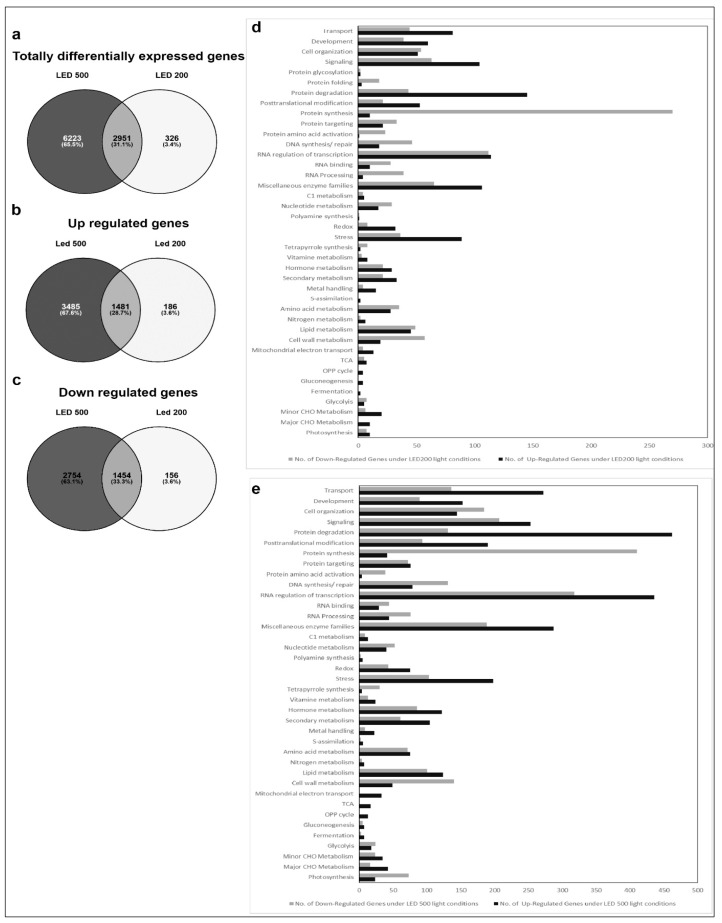
Figure 4.
Comparative gene expression analysis of RNA isolated from plants grown in LED100, LED200 and LED500. (a–c) Venn diagrams of a total differentially expressed; (b) up regulated; (c) down regulated genes; (d) Bar chart of up (black bars) and down (grey bars) regulated genes from plants grown in LED200; (e) Bar chart of up (black bars) and down (grey bars) regulated genes from plants grown in LED500.

