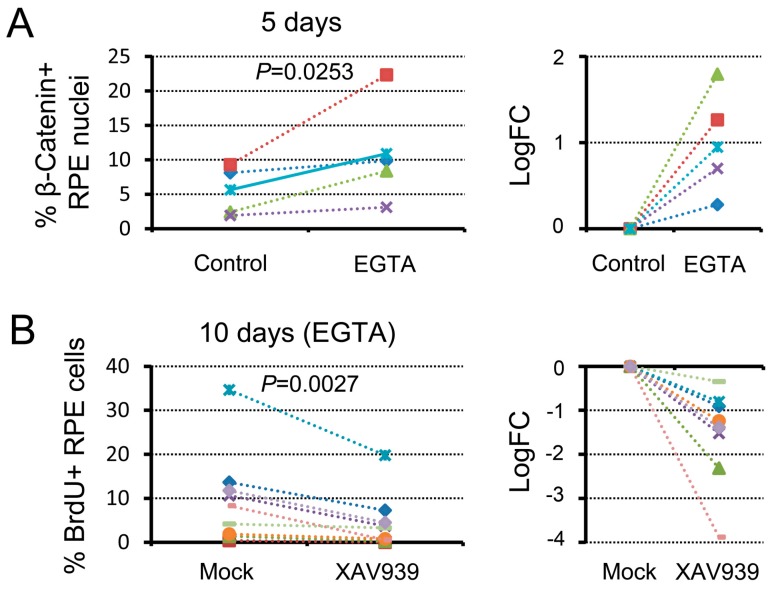
Figure 4.
Attenuation of cell–cell contact promotes cell cycle re-entry of RPE cells via β-catenin signaling. (A) Differences in the ratio of β-catenin+ nuclei in the Center of the RPE on day 5 between normal saline (control) and EGTA treatment. The right hand graph shows the relative changes after EGTA treatment, and was plotted in log2 (fold change). The value increased significantly (Sheffe’s pairwise comparison test following the Friedman test, p = 0.0253) after EGTA treatment; (B) Effect of a β-catenin signaling inhibitor, XAV939, on cell cycle re-entry of RPE cells in the condition of EGTA treatment (9 newts). The left hand graph shows the proportion of BrdU+ cells in the Center of the RPE on day 10, and the right hand graph shows the relative changes in the presence of XAV939. The value decreased significantly (Sheffe’s pairwise comparison test following the Friedman test, p = 0.0027) in the presence of XAV939.

