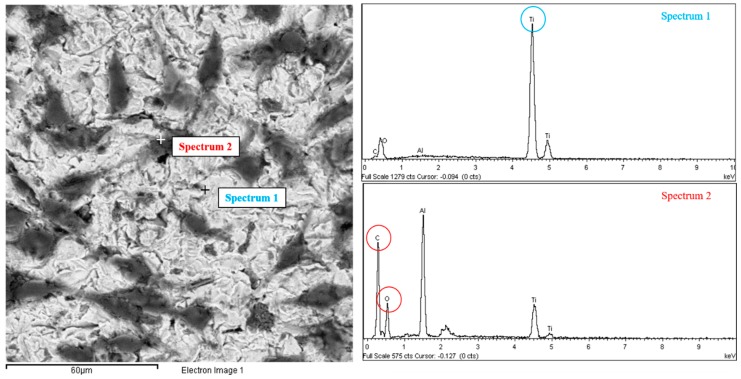
Figure 6.
MLO-Y4 under scanning electron microscope (SEM) with X-ray analysis: Two points of a treated titanium plate cultured with MLO-Y4 cell line are analyzed with the X-ray analysis of the SEM resulting in two spectra of components. In the SEM image, the darker gray area indicated as “Spectrum 2” is confirmed to be of organic nature, due to the high peaks of Oxigen (O) and Carbon (C), meanwhile the absence of those peaks and the prevalence of Titanium peak (Ti) confirm the inorganic nature of the lighter gray area indicated as “Spectrum 1”.

