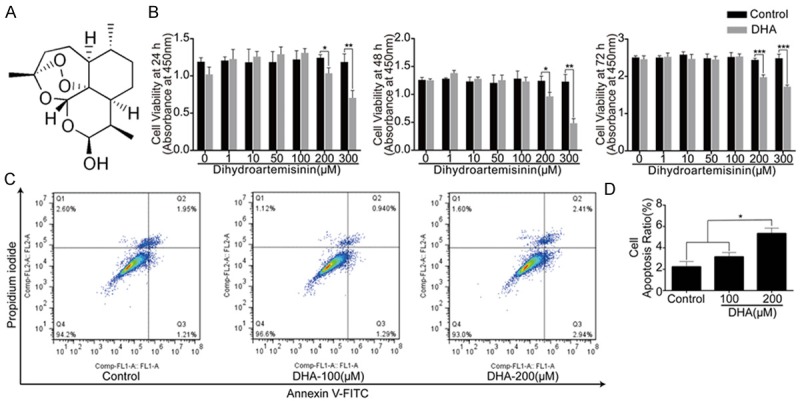
Figure 2.

High concentrations of DHA inhibited MSCs proliferation and induced cell apoptosis of MSCs. DHA concentration of 100 μM was regarded safe and used for following experiments. A: Chemical formula of DHA. B: CCK8 analysis of cell viability of MSCs treated with different concentrations of DHA for 24 h, 48 h and 72 h. C: FCM analysis of cell apoptosis rate of MSCs treated with basic medium for 72 h with different dosages of DHA treatments. X axis represents Annexin V-FITC and Y axis represents Propidium iodide. D: Quantification analysis of cell apoptosis rate. The data in the figures represent the averages ± SD. Significant differences between the treatment and control groups are indicated in the graph with the detailed corresponding P-values from Student-Newman-Keuls post hoc tests, *(P<0.05) or **(P<0.01) or ***(P<0.001).
