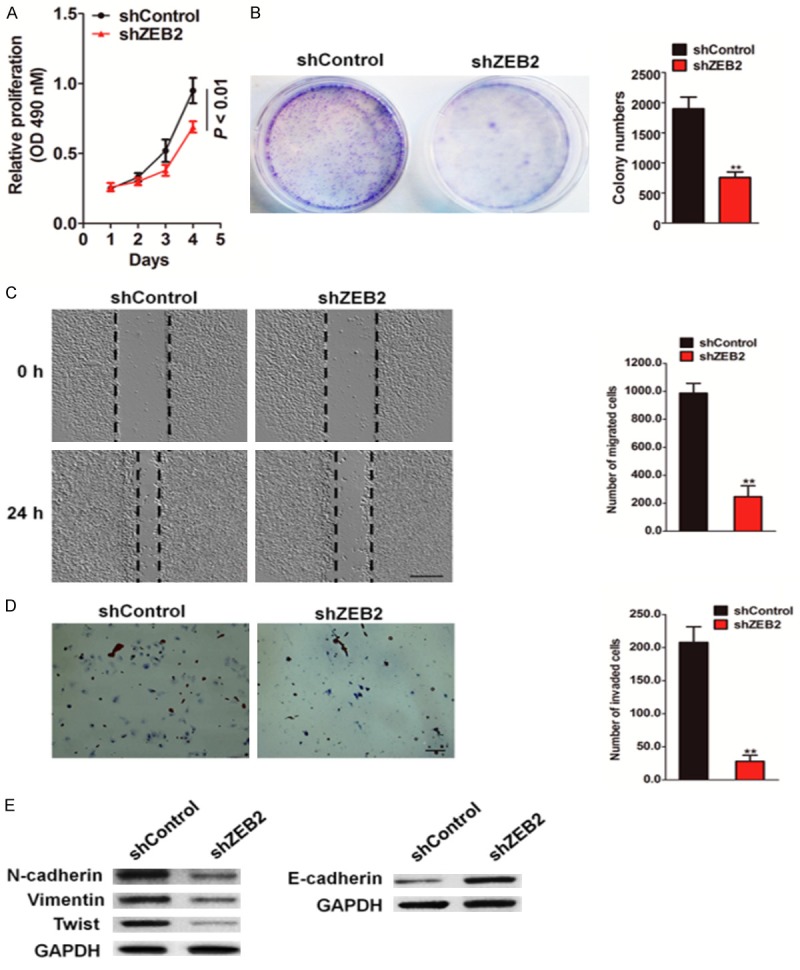
Figure 2.

Knock-down of ZEB2 repressed the metastasis capacity of HCT116 cells. A. MTT assay analysis of cell proliferation in HCT116-shZEB2 and control cells at 24, 48, 72 and 96 hours, respectively (*P < 0.01). B. Representative micro-graphs of the colonies formed by indicated HCT116 cells (left panel). Histograms reported the mean ± SD of the colonies formed by indicated cells. C. ZEB2-shRNA and control-shRNA transfected HCT116 cells were wounded with pipette and wound closure percentage was quantified 24 h after scratch relative to that at 0 h. *P < 0.05 compared to the control cells. Scale bar represents 100 μm. D. HCT116 cells transfected with ZEB2 shRNA or control shRNA were seeded in the upper chamber. After 24 h, the cells invaded through the membrane were stained and counted in five random microscopic fields (Scale bar: 50 μM). Representative a histogram of the quantification of invasion number was shown. E. Expression levels of EMT related proteins were investigated by immunoblotting. GAPDH was used as a loading control. *P < 0.05, **P < 0.01 compared between control-shRNA transfected HCT116 cells and ZEB2-shRNA cells; Data were presented as the mean ± SD from three independent measurements.
