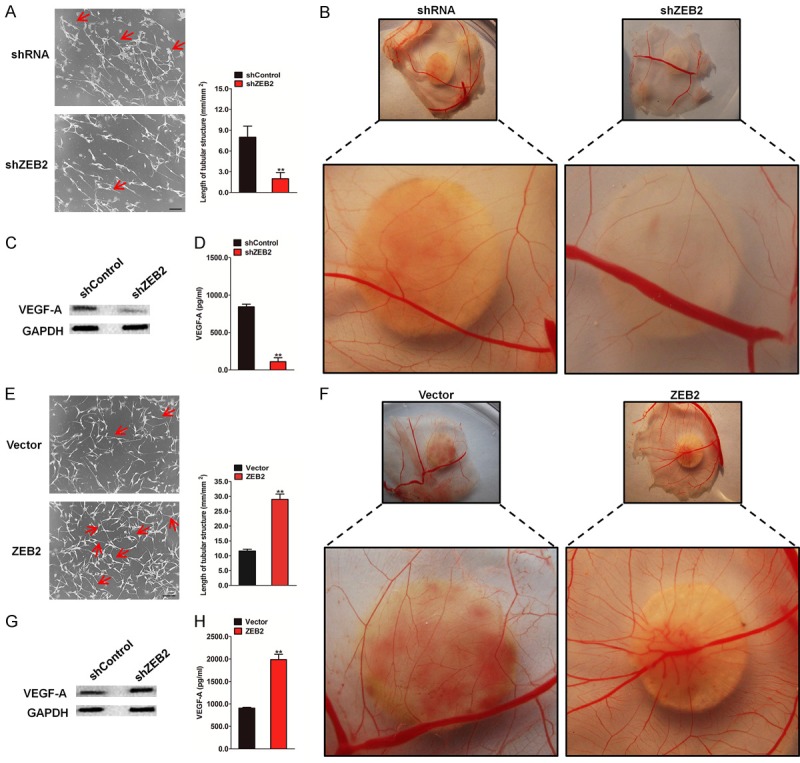
Figure 4.

Effect of ZEB2 silencing or over-expression on tumor angiogenesis. A. Tubee formation was analyzed after HUVECs were cultured with conditioned medium from HCT116 cells transfected with shZEB2 or control. The quantification of the tube length was done by Image Pro Plus software and was presented in the histogram right. Scale bar represents 50 μm. B. Representative images of the CAM blood vessels stimulated with conditioned medium from ZEB2-depleted HCT116 cells or control cells. C. Western blotting with anti-VEGF-A antibody of cell lysates from the indicated HCT116 cells. D. Levels of VEGF-A in the medium conditioned from the indicated cells and harvested at 24 h. Each bar represents the mean ± SD of three independent experiments. **P < 0.01. E. Representative images (left panel) and quantification (right panel) of HUVECs cultured on matrigel-coated plates with conditioned medium from ZEB2-transfected HCT116 cells or control cells. Scale bar represents 50 μm. F. Representative images of the CAM blood vessels stimulated with conditioned medium from indicated HCT116 cells. G. Western blotting analysis of ZEB2 levels in HCT116 control and HCT116-ZEB2 cells. H. Levels of VEGF-A in the medium conditioned from the indicated cells and harvested at 24 h. Each bar represents the mean ± SD of three independent experiments. **P < 0.01.
