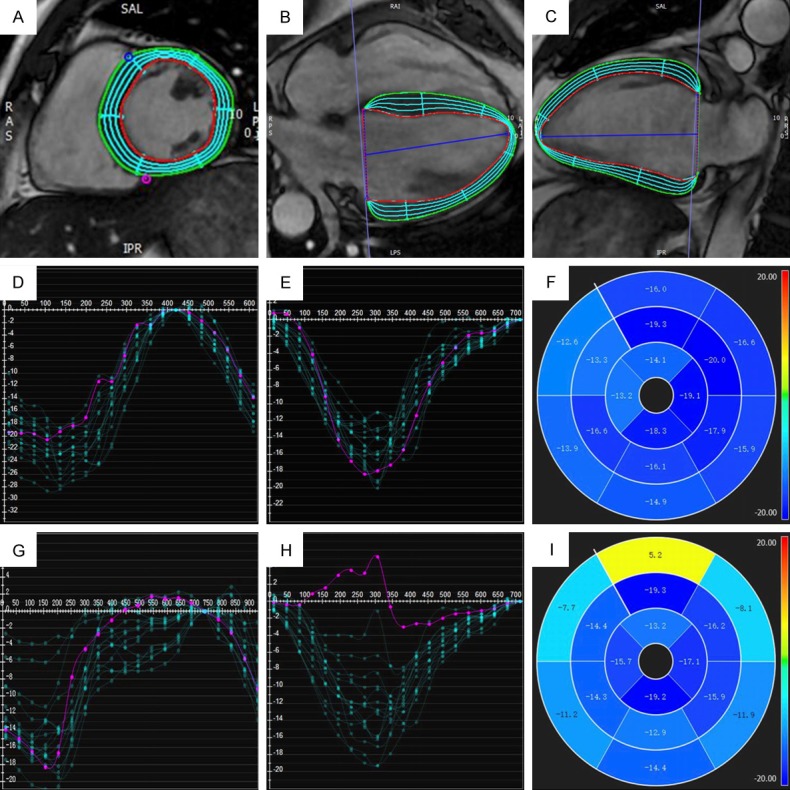
Figure 1.

LV CMR-FT. (A) Circumferential strain from LV short-axis. Longitudinal strain from 4-chamber (B) and 2-chamber (C) cines. (D-F) are the representative segmental CS curves (D), LS curves (E) and 16-segmental map of peak LS (F) from a healthy volunteer, while (G-I) are segment CS curves (G), LS curves (H) and 16-segmental map of peak LS (I) from a VA patient.
