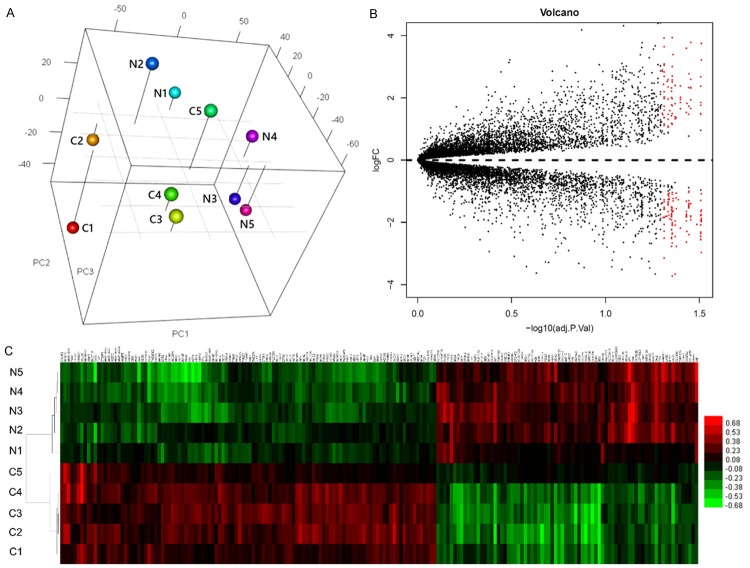
Figure 1.
Overview of the expression profiles of samples of cervical cancer tissues and healthy control tissues. A: Three-dimensional principal component analysis. The N and C represent normal controls and cervical cancer, respectively. The numeric labels represent different samples. B: Volcano plot to highlight the differentially expressed genes (DEGs) among all the transcripts. The red dots represent significant DEGs between tumor and normal tissues, and black dots represent DEGs with no significance. C: A heatmap showing clusters of DEGs.

