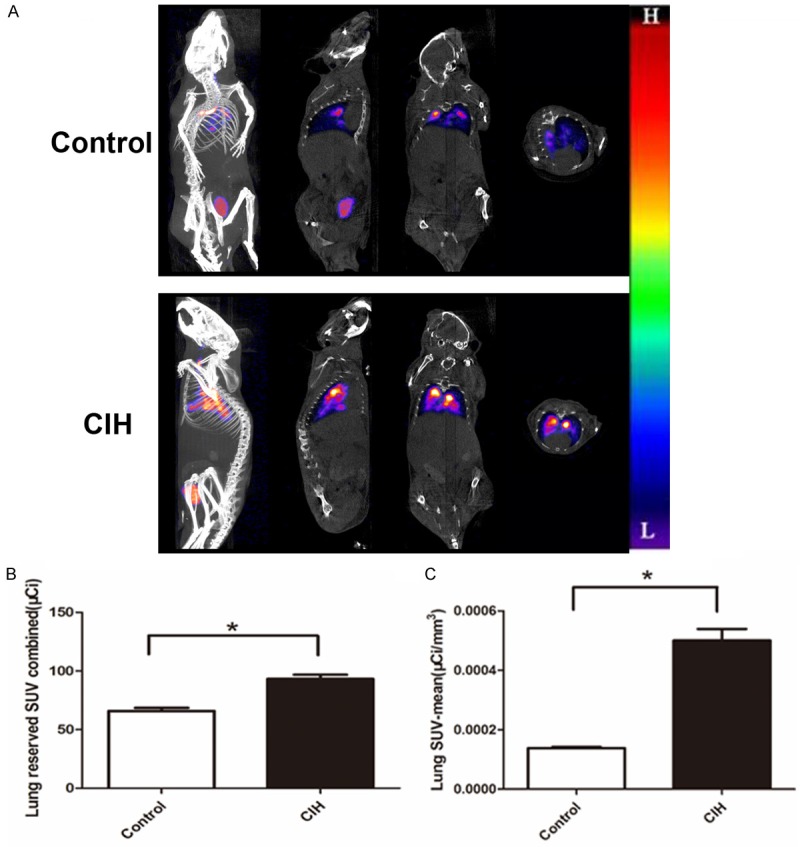
Figure 1.

Mice with CIH had increased radioactive deposit in the lungs. N=6 per group. A. Single-photon emission computed tomography/computed tomography showed the reconstruction, coronal, sagittal, and transverse sections (from left to right) in the control (the upper images) and CIH groups (the lower images). The color from “L” to “H” indicate radioactivity accumulation from low to high. B. Lung reserved SUV sum in the lung in the CIH group and the control group (P=0.011). C. Lung SUV-mean value in two groups (P=0.006). Data represent three independent experiments. All data were analyzed by SPSS using independent-sample t-test.
