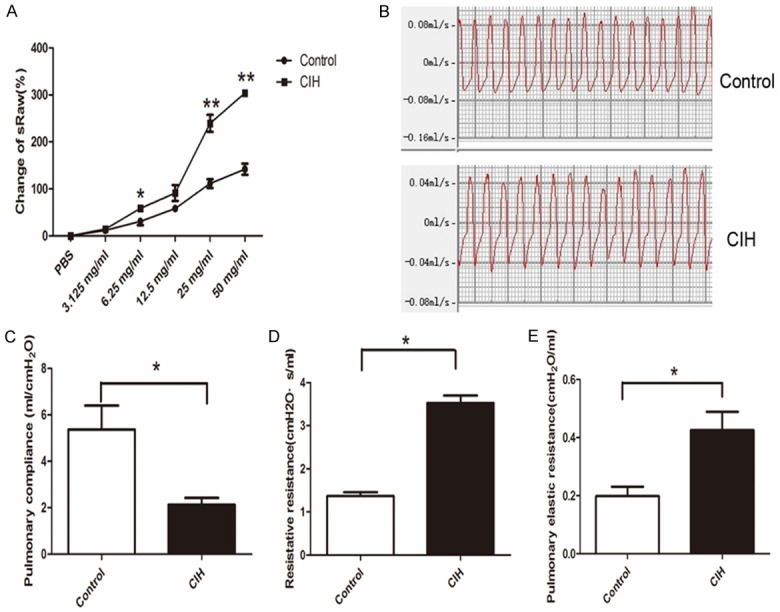
Figure 2.

CIH increased airway resistance. N=6 per group. A. Change of sRaw curve in each stimulation point in two groups. Significant difference shown in 6.25 mg/mL, 25 mg/mL, and 50 mg/mL stimulation points (P<0.05). B. Respiratory wave in control and CIH groups. Mice with CIH showed lower respiratory flow, nearly 0.04 mL/s, compared to the control mice (0.08 mL/s). C. Pulmonary compliance statistical graph of two groups (P=0.038). D. Resistive resistance in two groups (P=0.0004). E. Pulmonary elastic resistance in two groups (P=0.0336). Data represent three independent experiments. All data were analyzed by SPSS using independent-sample t-test.
