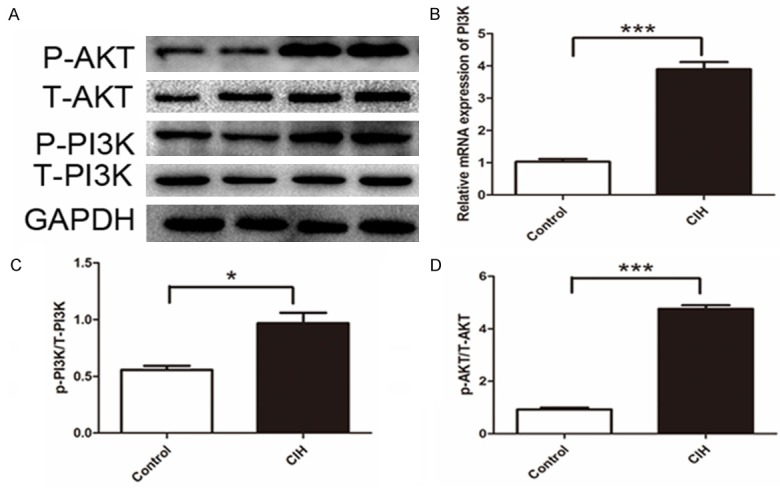
Figure 6.

Activation of phosphorylation of PI3K/AKT pathway. A. Western blot bands of target molecular. B. Gene expression of PI3K. C. Intensity of P-PI3K to total PI3K (T-PI3K) P=0.0135. D. Intensity of P-AKT to total AKT (T-AKT) P<0.001. Data represent three independent experiments. All data were analyzed by SPSS using independent-sample t-test.
