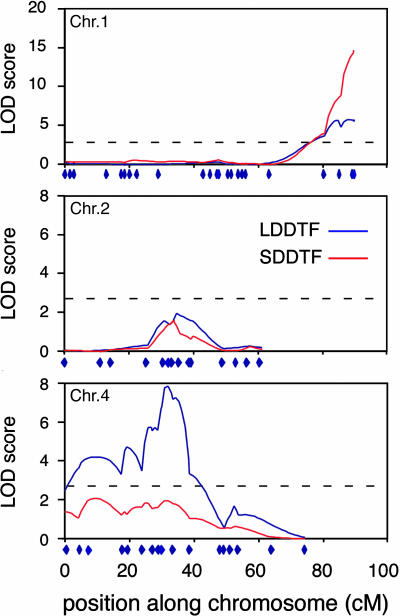
Fig. 3.
QTL maps of chromosomes 1, 2, and 4 for DTF in LD (blue) or SD (red). Results from interval mapping using bqtl are shown with logarithm of odds scores on the y axis versus position on the chromosomes on the x axis. Marker positions are indicated at the bottom of each chromosome. The dotted gray line corresponds to a logarithm of odds score threshold of 2.64, which represents a P = 0.05 genome wide threshold set by permutations.

