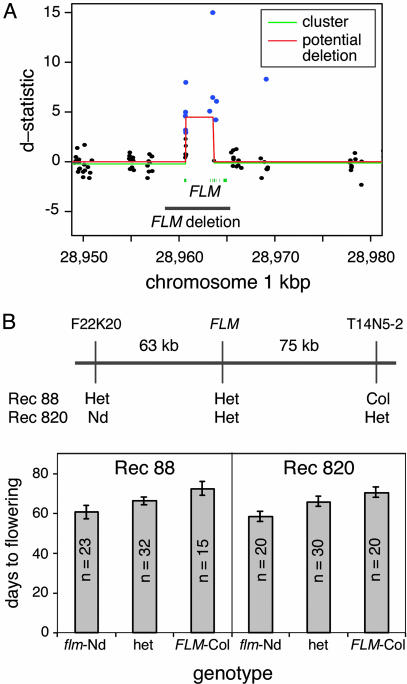
Fig. 4.
Deletion of the FLM locus in Nd. (A) Results of linear-clustering algorithm based on hybridization of labeled genomic DNA from Nd-1 and Col to ATH1 expression arrays. Closed circles represent d-statistics for each feature; single-feature polymorphisms are shown in blue, and nonsignificant features are shown in black. The lines correspond to clusters of features (green) that qualify as potential deletions (red) (see ref 31). The FLM deletion in Nd-1, verified by sequencing, is indicated by a black line. FLM exons are shown in blue. The deleted sequence is flanked by parallel repeats of GTATAAT. (B) Fine mapping of FLW1 QTL. Genotypes at markers F22K20, FLM, and T14N5-2 are shown for two plants with recombination events flanking FLM (see Materials and Methods). Flowering time means were derived for progeny of recombinants grown in SD and genotyped at FLM. Error bars denote 95% confidence intervals. Regression of DTF on the number of Col alleles showed the additive allele effect (2a) to be 12.1 days (P < 10-7) in Rec820 and 11.5 days (P < 10-7) in Rec88; dominance effects could not be rejected.

