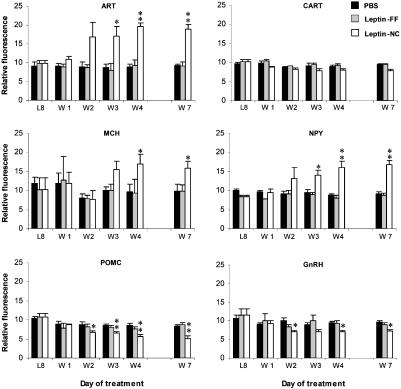
Fig. 3.
Quantitative real-time PCR analysis of neuropeptide expression in the hypothalamus. Neuropeptide RNA expression levels in PBS control mice, leptin-FF mice, and leptin-NC mice were analyzed at the end of the dark cycle on day 8 of leptin treatment (L8) and days 1, 2, 3, 4, and 7 after leptin withdrawal (W1–W7, n = 6 per group). Data for TaqMan analysis are reported in relative fluorometric units (×10) normalized to cyclophilin expression. *, P < 0.5 vs. PBS, FF; **, P < 0.005 vs. PBS.

