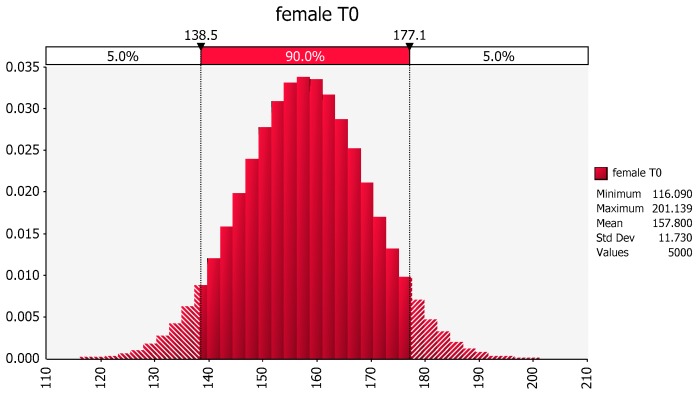
Figure 4.
Distribution of female weights based upon the mean and variance of the sample values of body weights of females in the no exercise group. The X-axis represents body weight (lbs) and the Y-axis represents the fraction of the population of females at that body weight based upon the information contained within subset of individuals included in this hypothetical study. The possible values of the Y-axis range from a value of zero (no individuals expected at that body weight) to 1 (all individuals in the population will have the identical body weight).

