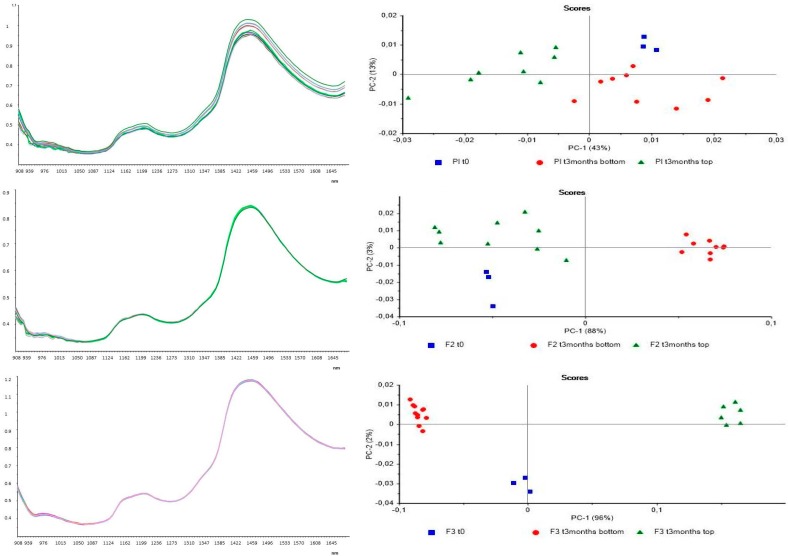
Figure 8.
Left spectra and right PCA of from the top: placebo t0 (first three lines from above) and after three months, top (three lines in the center) and bottom (three lines below); F2 t0 (green line) and after three months, top ( blue line) and bottom (purple line); F3 t0 (purple line)and after three months, top (red line) and bottom (green line).

