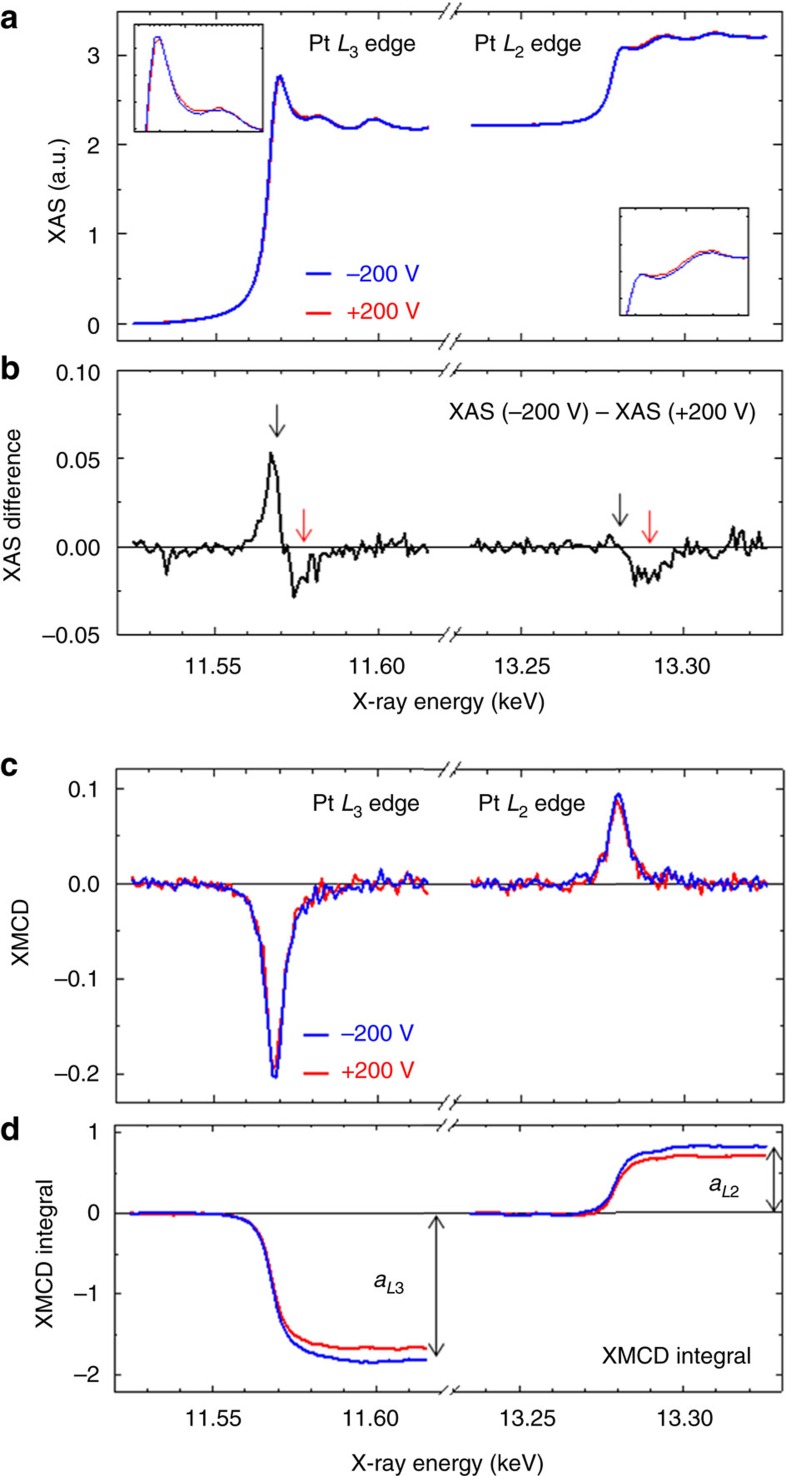
Figure 2. Synchrotron XAS.
(a) Results of XAS measured at the Pt L2,3 edges. The blue and red curves trace the polarization-averaged XAS spectra taken under conditions of −200 V and +200 V, respectively. The insets show magnified views. (b) The XAS spectra at +200 V was subtracted from the XAS spectra at −200 V. (c) XMCD spectra measured at the Pt L2,3 edges. (d) Traces depicting the numerical integrals of the XMCD spectra. All measurements were taken at room temperature under perpendicularly applied magnetic fields of ±60 mT, where the magnetization of the FePt was saturated normal to the film plane.

