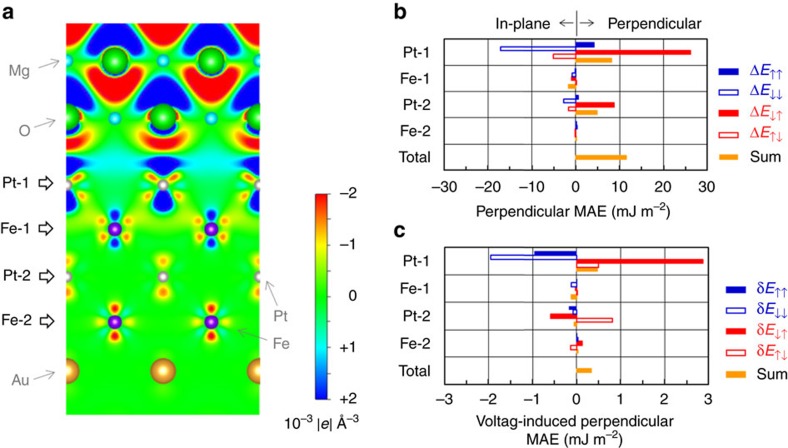
Figure 4. Theoretical study.
(a) A schematic diagram of the computational model with the induced charge density. The induced charge density at an electric field of +0.732 V nm−1 in the MgO is subtracted from the induced charge density at −0.732 V nm−1. Electric fields of ∓0.732 V nm−1 induce δntotal=±0.03, where δntotal is the total induced holes of the Pt-1 atom. The blue and red areas represent the hole accumulation and depletion, respectively. (b) The perpendicular MAE (ΔE) of each monatomic layer calculated with equation (6), where ↑ and ↓ denote the majority and minority spin bands, respectively. (c) The voltage-induced perpendicular MAE changes (δE) calculated with equation (6). The MAE at +0.732 V nm−1 is subtracted from the MAE at −0.732 V nm−1. The spin-flip-term-induced values of MAE (E↓↑ and E↓↑) of the Pt-1 layer provide the dominant contribution to the perpendicular MAE and its voltage-induced change.

