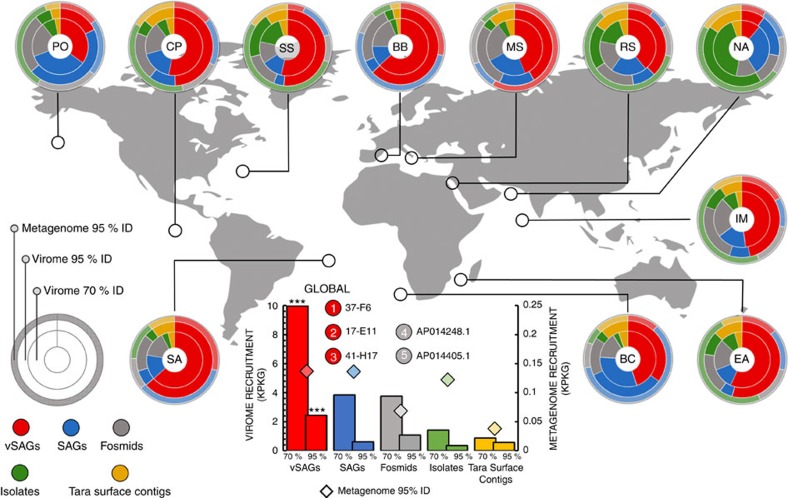
Figure 2. Relative abundance and distribution of surface marine viruses.
Virome and microbiome metagenomic fragment recruitments of marine viruses in each ocean. Rings represent the relative microbiome and virome recruitment frequency for each genomic data set, corresponding to the relative abundance of viral populations. External ring is for the microbiome recruit by using ≥95% nucleotide identity threshold (species level). Inner and medium rings depict the virome recruitment at two different nucleotide identity cut-offs, ≥70% and ≥95%, corresponding to the genus and species levels, respectively (Supplementary Fig. 10 and Supplementary Notes 4 and 5). Viral genomic data sets used were: 40 surface vSAGs (this study), 179 reference virus isolates (Supplementary Table 9), 1,148 viral fosmids10, 20 viral genomes from uncultured prokaryotic single cells26 and 3,018 surface viral contigs from the Tara expedition3. For this calculation: (1) normalized recruitment as the total recruited nucleotides (kb) per kb of viral genome per Gb of virome (KPKG) was estimated for each virus genome, (2) mean normalized recruitment was calculated for each virus genomic data set (see also Supplementary Fig. 11) and (3) mean was normalized by the sum of means from all virus genomic data set expressed as relative recruitment. Statistically significant differences between the recruitment frequency average of the vSAGs versus the rest of viral groups are indicated (***; ANOVA P value <0.001). Viromes and microbiomes from previous surveys3,23,24,25 used here are abbreviated as: Pacific Ocean (PO), Chile-Peru oceanic region (CP), South Atlantic (SS), Red Sea (RS), Mediterranean Sea (MS), Northwest Arabian Sea upwelling (NA), Indian Monsoon gyre province (IM), Eastern Africa Coastal Province (EA), Benguela Current (BC) and Sargasso Sea (SS). The microbiome and virome from Blanes Bay Microbial Observatory (BB), where surface vSAGs were obtained, was constructed in this study. Global oceanic viromics and microbiome fragment recruitments for each virus genomic data set is represented in the centre of the picture, circles represent overall oceanic top-5 ranking of most abundant viruses at the species level (≥95% of identity).

