Fig. 7.
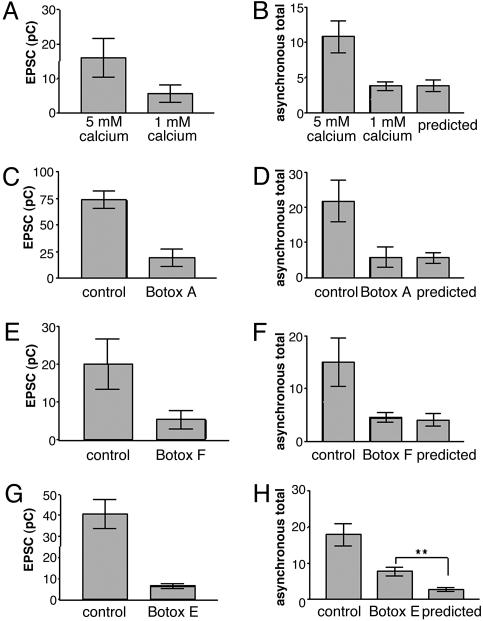
The SNARE complex regulates asynchronous release. (A) Comparison of EPSC charge integral in 5 mM Ca2+ vs. 1 mM Ca2+. The ratio of the EPSC charge integral in 1 mM Ca2+ to 5 mM Ca2+ was 0.35. (B) Total number of asynchronous events in 5 mM Ca2+ vs. 1 mM Ca2+. The predicted number of events was 3.8 ± 0.82 SEM, whereas the 1 mM Ca2+ was 3.8 ± 0.62 SEM. Student's t test did not reveal a difference between the predicted total and the 1 mM total. n = 5 for 5 mM Ca2+ and 1 mM Ca2+. (C) Comparison of EPSC charge integral in 5 mM Ca2+ vs. Botox A cultures. The ratio of the EPSC charge integral in 1 mM Ca2+ to 5 mM Ca2+ was 0.26. (D) Total number of asynchronous events in 5 mM Ca2+ vs. 1 mM Ca2+. The predicted number of events was 5.6 ± 1.5 SEM, whereas the Botox A amount was 5.8 ± 2.9 SEM. Student's t test did not reveal a difference between the predicted total and the 1 mM total. n = 5 for 5 mM Ca2+- and Botox A-treated cultures. (E) Comparison of EPSC charge integral in 5 mM Cal2+ vs. Botox F. The ratio of the EPSC charge integral in 1 mM Ca2+ to 5 mM Ca2+ was 0.26. (F) Total number of asynchronous events in 5 mM Ca2+ vs. Botox F. The predicted number of events was 4.1 ± 1.2 SEM, whereas the Botox F amount was 4.4 ± 0.9 SEM. Student's t test did not reveal a difference between the predicted total and the 1 mM total. n = 5 for 5 mM Ca2+- and Botox F-treated cultures. (G) Comparison of EPSC charge integral in 5 mM Ca2+ vs. Botox E. The ratio of the EPSC charge integral in 1 mM Ca2+ to 5 mM Ca2+ was 0.16. (H) Total number of asynchronous events in 5 mM Ca2+ and Botox E. The predicted number of events was determined as described in Materials and Methods. Student's t test revealed a difference between the predicted total and the Botox E total. (P < 0.01). The predicted amount was 2.848 ± 0.49 SEM, whereas the Botox E amount was 7.8 ± 1.15 SEM. n = 5 for 5 mM Ca2+- and Botox E-treated cultures.

