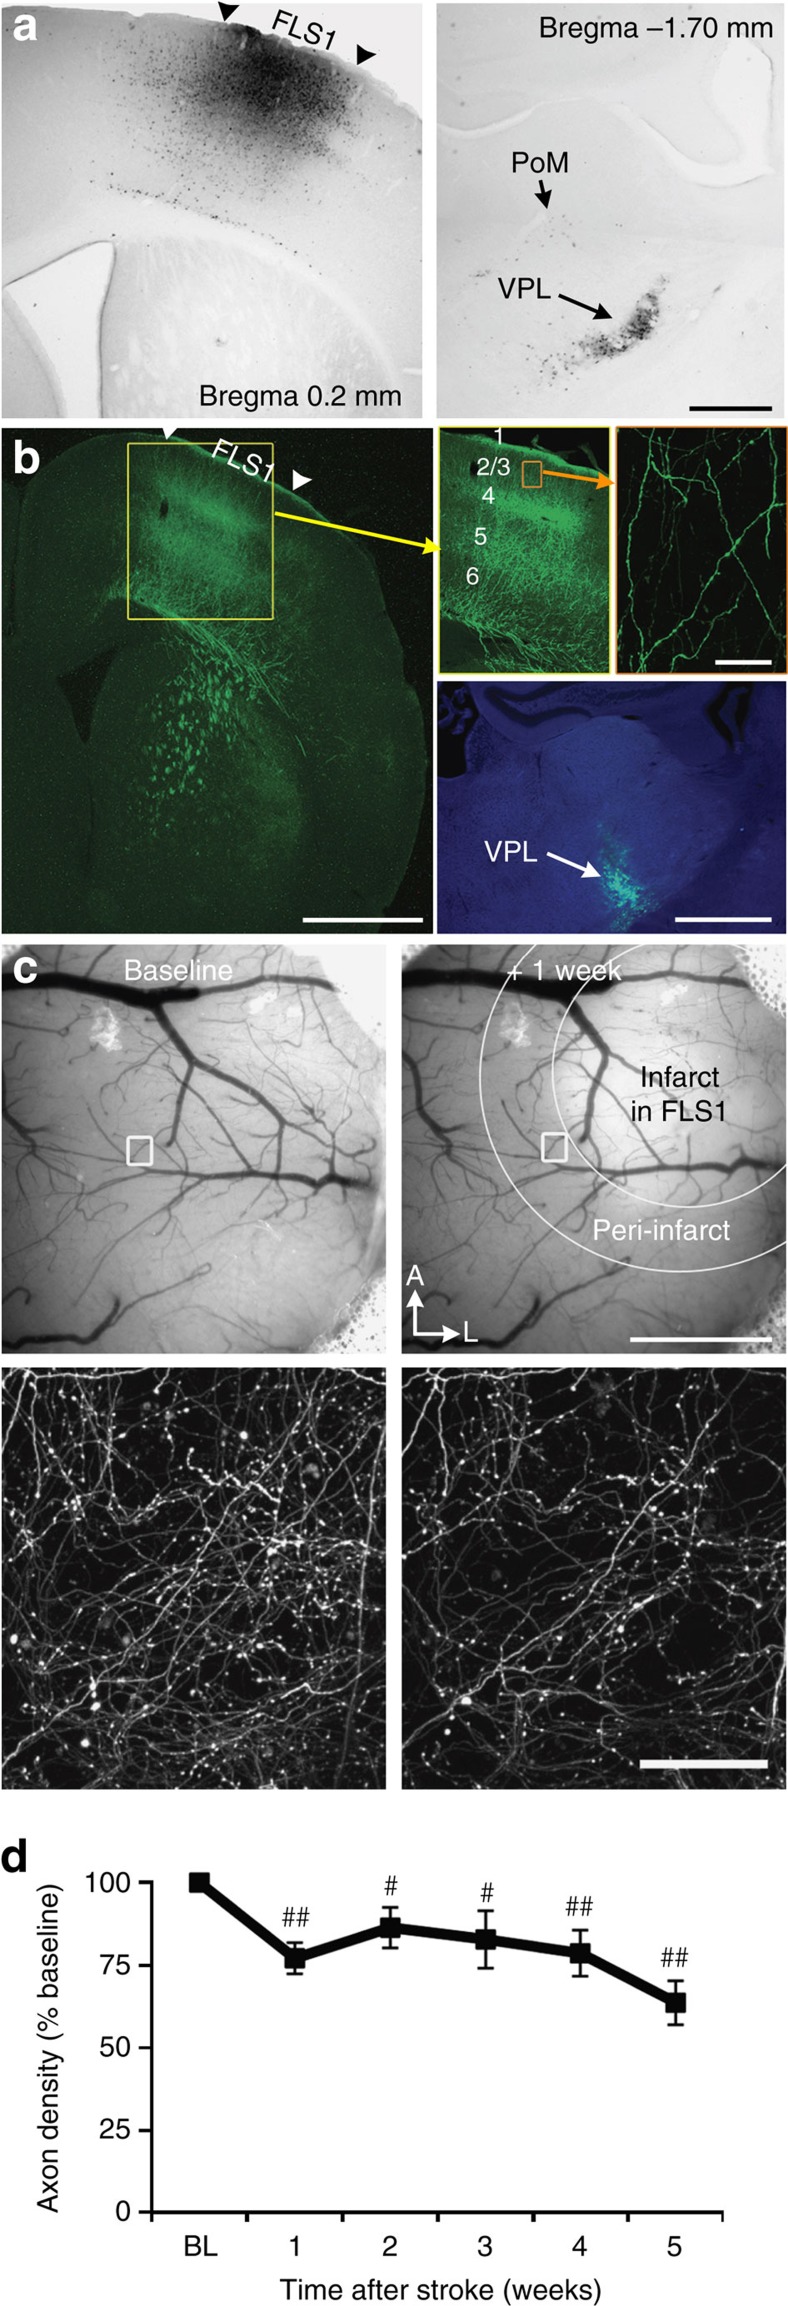
Figure 1. Survival of peri-infarct thalamocortical projections after focal stroke.
(a) Left, bright-field image shows cholera toxin B injection site in primary forelimb somatosensory cortex (FLS1). Right, retrograde labelling of neurons is primarily concentrated in the VPL nucleus, with sparse labelling in PoM nucleus of the thalamus. (b) Distribution of anterogradely labelled eGFP-expressing thalamocortical axons in the FLS1 cortex after AAV injection in the ventral thalamus (bottom right). (c) Bright-field images of the cortical surface before and 1 week after focal stroke in FLS1 cortex. Below each image is a maximal intensity z-projection two-photon image of thalamocortical axons in cortical layer 1 of FLS1/peri-infarct cortex. (d) Graph shows the density of axons after stroke relative to BL levels (n=15 mice; #P<0.05; ##P<0.01 relative to BL based on one-sample t-tests). Data are means±s.e.m. Scale bars, (a) 0.5 mm; (b) 1 mm (top left), 50 μm (top right), 1 mm (bottom right); (c), 1 mm (top right), 50 μm (bottom right).

