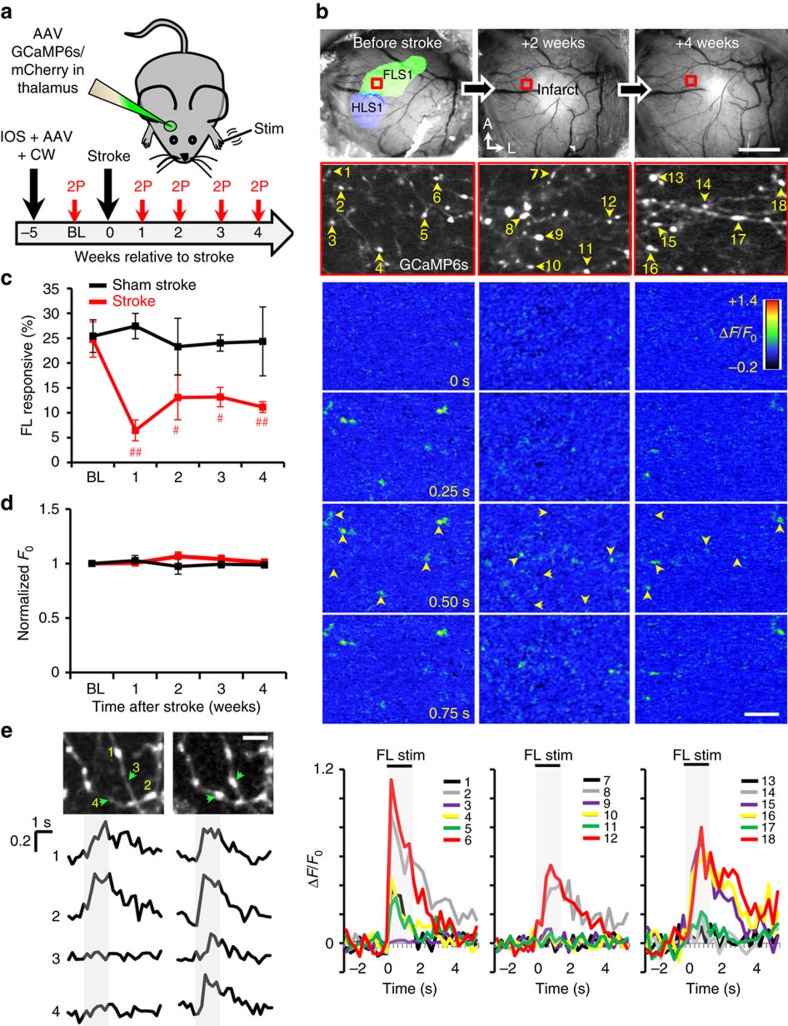
Figure 2. Thalamocortical axons are less responsive to forelimb stimulation after stroke.
(a) Graphical summary of GCaMP6s imaging experiments. (b) Top, bright-field images of the cortical surface before and after stroke (top row). IOS imaging was used to delineate the functional representation of the FLS1 and primary hindlimb somatosensory cortex. Below; images showing GCaMP6s-expressing thalamocortical boutons (numbered 1–18) within boxed regions. Colour montages below show forelimb-evoked changes in GCaMP6s fluorescence (ΔF/F0) for axonal boutons imaged before stroke and 2–4 weeks later. Plots show calcium responses to forelimb stimulation (ΔF/F0) within individual boutons at each time point. (c) Graph shows the percentage of forelimb responsive thalamocortical boutons plotted as a function of time after stroke (2,825 boutons were analysed in 6 stroke mice) or sham (1,706 boutons analysed in 4 mice) procedure. (d) Normalized GCaMP6s fluorescence (F0) in axonal boutons over time. (e) Top, images show mCherry-labelled thalamocortical boutons (numbered 1–4) imaged 1 week apart. Bottom, shows forelimb evoked responses (ΔF/F0) within each numbered bouton. Note that newly formed boutons (#3, 4) show detectable forelimb-evoked calcium responses. Data are means±s.e.m. #P<0.05; ##P<0.01 based on t-tests comparing BL to each week of recovery. Scale bars, (b) 1 mm (top right), 10 μm (bottom right); (e) 5 μm.

