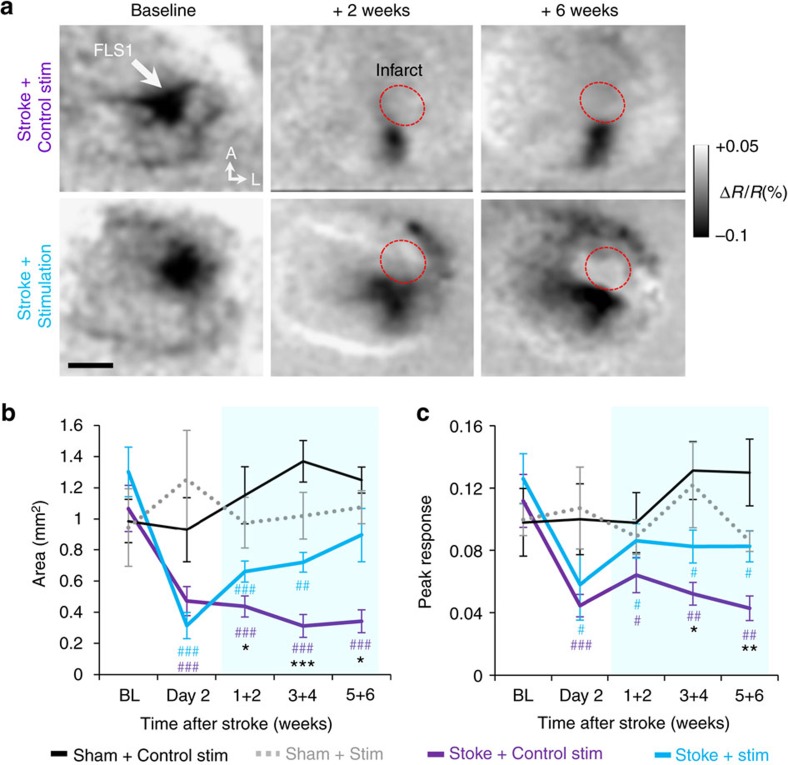
Figure 6. Optogenetic stimulation enhances recovery of sensory cortical circuits.
(a) Time lapse IOS images showing the primary somatosensory cortical response (darkened area) to stimulation of the contralateral forepaw (100 Hz for 1 s). Red circle denotes infarct area. Grey levels in each image reflect percent changes in light reflectance averaged over 0.5–1.5 s after forelimb stimulation relative to BL. (b) Graph plotting the area of cortical territory activated by forelimb stimulation in sham stroke controls (Control stimulation: n=5 mice; ChR2 stimulation: n=7 mice) or mice with stroke that received control or optogenetic stimulated mice (Control stimulation: n=11 mice; ChR2 stimulation: n=10 mice). (c) Graph plotting peak cortical responses (absolute value of %ΔR/R) to forelimb stimulation. Data are means±s.e.m. #P<0.05, ##P<0.01, ###P<0.001 based on t-tests comparing post-stroke time points in each group designated by colour to respective BL values. *P<0.05, **P<0.01, ***P<0.001 based on t-tests comparing stroke+stimulation versus stroke+control stimulation. Scale bar, (a) 1 mm.

