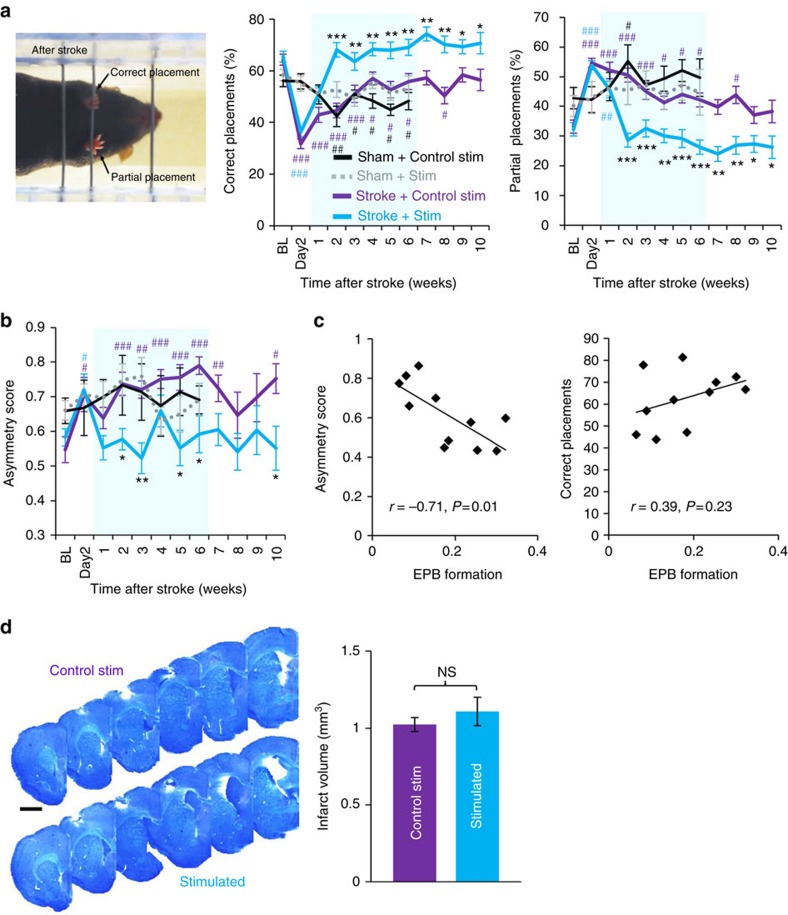
Figure 7. Recovery of forepaw function is enhanced by optogenetic stimulation.
(a) Left, image showing a mouse making a partial placement with the stroke-affected paw and a correct forepaw placement with the good limb. Centre and right, graphs showing the percentage of total placements (of the stroke affected forepaw) that were classified as either ‘correct’ or ‘partial’ in sham stroke controls (Control stimulation: n=5 mice; ChR2 stimulation: n=6 mice) and stroke affected mice that received control or optogenetic stimulation (n=8 mice for each stroke group). (b) Graph shows asymmetry in tape removal latency (scores >0.5 indicate more time spent removing tape from stroke affected paw) in each group (c) Scatter plots showing the correlation between EPB formation rates at 2 or 3 weeks recovery with their respective scores on tape and ladder tests. (d) Representative montages of cresyl violet stained coronal sections showing the anterior to posterior extent of focal photothrombotic stroke. Right, analysis of infarct volume in each group (n=6 mice per group, P=0.21 based on t-test). Data are means±s.e.m. #P<0.05, ##P<0.01, ###P<0.001 based on t-tests comparing post-stroke time points in each group designated by colour to respective BL values. *P<0.05, **P<0.01, ***P<0.001 based on t-tests comparing stroke+stimulation versus stroke+control stimulation. Scale bar, (d) 1 mm.

