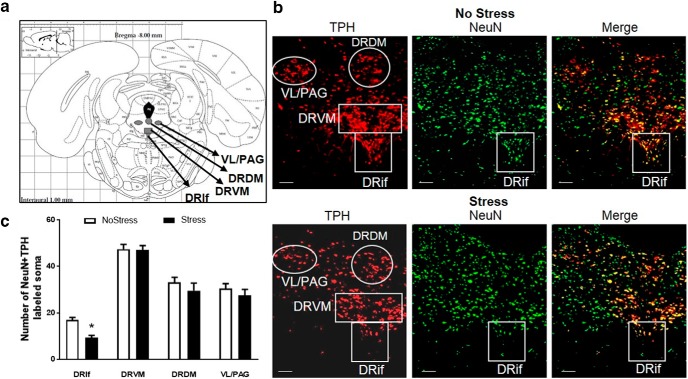
Figure 5.
NeuN + TPH-positive cells in the DRN. 5HT cells in the DRN were counted in Stress and NoStress rats 1 week after CUS. (NoStressDRif, n = 8; NoStressDRVM, n = 8; NoStressDRDM, n = 8; NoStressVL/PAG, n = 8; StressDRif, n = 8; StressDRVM, n = 8; Stress DRDM, n = 5; and StressVL/PAG, n = 5). a, Identification of subregions analyzed within the DRN based on the rat brain atlas (Paxinos and Watson, 2004). b, Representative images (10× magnification) of NeuN + TPH-positive cells in the DRN. Red indicates TPH; green, NeuN; and yellow, NeuN + TPH colocalization in No Stress and Stress rats. c, Graph of NeuN + TPH-positive cells in the DRN subregions. DRif subregion shows a significant decrease in the number of NeuN + TPH cells after Stress (*p < 0.001). White scale line indicates 100 μm.

