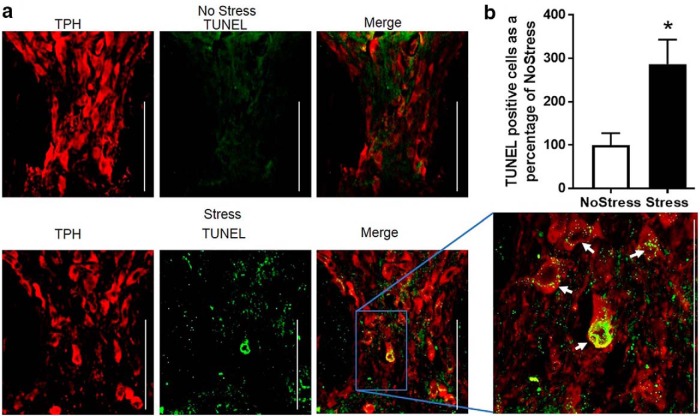
Figure 6.
TUNEL-positive cells in the DRN after 17 d of CUS. a, Top and bottom panels show representative immunofluorescence images of the DRif in the NoStress and Stress groups, respectively, of TPH immunoreactivity (red), TUNEL stain (green), and the merge (yellow). There was minimal to no distinct TUNEL staining in the NoStress group but punctate TUNEL staining surrounding the nuclei of TPH-positive cells in the Stress group. The white arrows point to TUNEL-positive cells in the DRif of the Stress group. The expanded image is 60× magnification. White line/bar, 100 μm. Variations in TUNEL intensity is attributed to differences in the plane and angle of section of TUNEL-labeled soma in the DRif. b, Graph of TUNEL/TPH-positive cells normalized to NoStress (*p < 0.05; NoStress, n = 8; Stress, n = 8).

