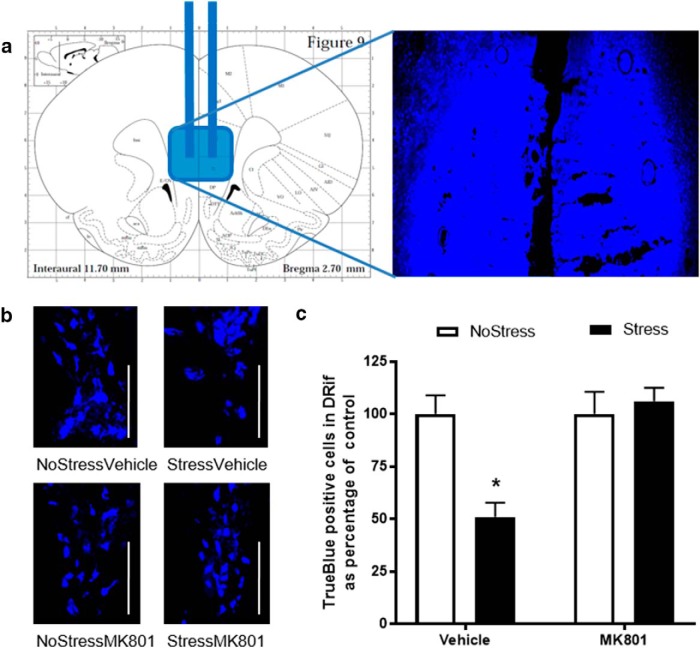
Figure 8.
Retrograde tracer TrueBlue injection into the mPFC in MK801-pretreated rats. a, Schematic representation of tracer injection into the mPFC according to the rat brain atlas (Paxinos and Watson, 2004). b, Representative images of TrueBlue-positive cells in the DRif in the NoStressVehicle, StressVehicle, NoStressMK801, and StressMK801 groups. White line, 100 μm (NoStressVehicle, n = 4; StressVehicle, n = 6; NoStressMK801, n = 8; and StressMK801, n = 8). c, Percentage of TrueBlue positive cells in the DRif in Stress and NoStress groups after intraperitoneal injection with either 1 ml/kg vehicle (saline) or 0.3 mg/kg MK801. The StressVehicle had a significantly decreased number of TrueBlue-positive cells in the DRif (*p < 0.01, StressVehicle vs all other groups).

