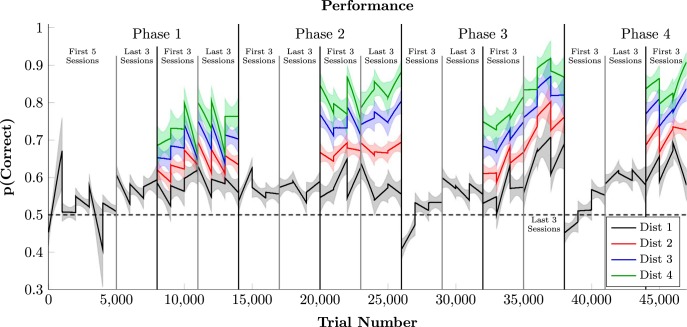
Figure 2.
Time series analysis of task performance, divided by symbolic distance, averaged across subjects. All sessions presented adjacent pairs (black), but only all-pairs sessions included symbolic distance of 2 (red), 3 (blue), and 4 (green). Discontinuities correspond to gaps between sessions. Shaded regions represent the 99% credible interval of the estimate.

