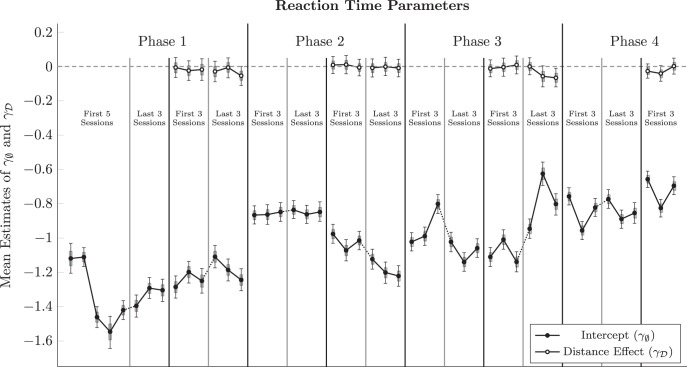
Figure 4.
Session-by-session of the intercept parameter (γφ in Eq. 3, in black) and “distance effect on trial zero” parameter (γD in Eq. 3, in white) in the regression analysis of log reaction time, averaged across subjects. Values of near zero indicate no differential effect on reaction time as a function of symbolic distance. Whiskers represent 99% credible intervals for the estimates. Shaded intervals represent 80% credible intervals.

