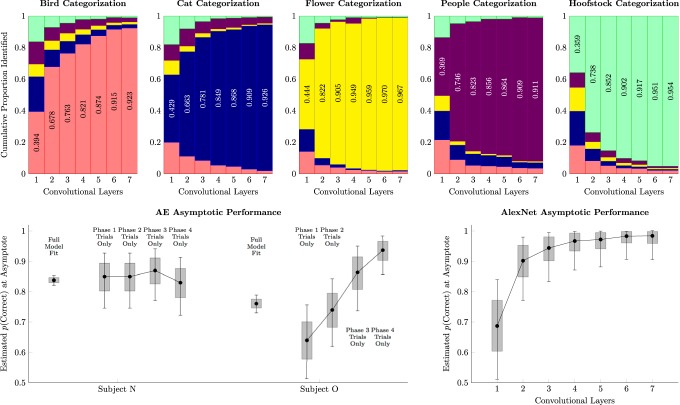
Figure 5.
Comparison of monkey performance and AlexNet, a deep learning network trained for image classification. Whiskers represent 99% credible intervals for the estimates. Shaded intervals represent 80% credible intervals. Top, Image classifications for each of the five categories by AlexNet, given the outputs at each of its seven convolutional layers. Each block assumes that a stimulus of the type given by the title has been presented, and cumulative proportions of the five classified categories are (plotted from bottom to top) birds (light red), cats (dark blue), flowers (yellow), people (dark purple), and hoofstock (light green). The proportion of correct classifications is also inscribed in the relevant block. Bottom left, Subjects' response accuracy for the pair AE at the end of each phase. “Full model fit” estimates use Equation 1 to estimate performance based on all trials across all phases. “Trial only” estimates are based on the proportion of correct responses to AE during the last session of each phase. Bottom right, AlexNet classification accuracy in forced two-item classification as a function of the number of convolutional layers used. The uncertainty in the estimates arises across multiple simulations using different training and validation sets of stimuli.

